Delhi in 2015 was an exceptional story though. In the actual poll, the vote shares obtained by different parties were: 54.3 per cent for the AAP, the BJP 32.3 per cent, the INC 9.7 per cent; the opinion poll predictions were nowhere close to the actual result.
Only a areful implementation of sophisticated statistical models will enhance the credibility of opinion polls, says Atanu Biswas.
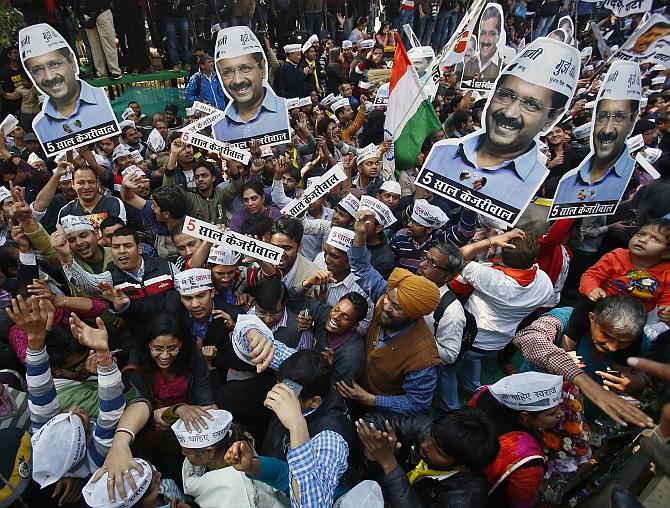
Another assembly election in Delhi is around the corner. People might be struggling to understand to what extent opinion polls can be relied on, at least so far as the Delhi assembly election is concerned.
The last time, in 2015, it was a disaster for the pollsters -- almost all the opinion polls failed to predict the ultimate result (the Aam Aadmi Party or AAP: 67, the Bharatiya Janata Party or BJP: Three, out of 70 seats).
Of the 27 opinion polls related to the 2015 Delhi assembly elections available on Wikipedia, the one that went the closest had predicted 51±6 seats for the AAP, while the most bizarre one had predicted only 17 seats for the winning party.
The average seats (votes) of these 27 opinion poll results was: the AAP 32 (40.22 per cent), the BJP 33 (39.7 per cent), the INC 4 (14.1 per cent). Samples from 51 constituencies were taken for these studies, on an average, and the average total sample size was 7,034.
Quite often, opinion polls fail to predict the number of seats of different parties due to the complex relationship between the percentage of votes and seats, while they usually don't make many mistakes predicting the vote shares of different parties.
Delhi in 2015 was an exceptional story though. In the actual poll, the vote shares obtained by different parties were: 54.3 per cent for the AAP, the BJP 32.3 per cent, the INC 9.7 per cent; the opinion poll predictions were nowhere close to the actual result.
Opinion polls exhibited disastrous predictions in many other recent polls, even pan-India.
Let's first try to understand how these polls are supposed to be carried out.
It's customary to estimate the sample size to keep the margin of error within, say, ±3 per cent. It is, however, unclear how many Indian opinion polls estimate the sample size a priori, and what their estimated margin of error is.
Even ignoring the sample size estimation part, to draw 7,000 samples across 50 (out of 70) constituencies one needs to select 50 constituencies randomly, and draw roughly 7,000/50=140 samples from each. Now, samples from each constituency should be taken by maintaining proportions of several key parameters -- gender ratio, several economic and educational groups, age groups, religions and castes -- of the actual population.
It's unknown whether and how these are maintained in different opinion polls.
In contrast, a new style of opinion polls has become popular elsewhere, especially in the United Kingdom, in the recent past.
YouGov's Multilevel Regression and Post-Stratification (MRP)-based election model had nicely predicted a hung Parliament in the UK in 2017 (seats predicted: the Conservatives: 302, the Labour: 269; actual: the Conservatives: 318, the Labour: 261), and also the victory of the Boris Johnson-led Conservatives in 2019, where the predicted seats (votes) were: the Conservatives 339 (43 per cent), the Labour 231 (34 per cent); while the actual numbers were: the Conservatives 365 (43.6 per cent), the Labour 203 (32.2 per cent).
Langer Research Associates, a United States polling company, also tested an MRP model during the 2016 US presidential election, and correctly predicted the outcome.
It's inevitable that such a model will soon be attempted in opinion polls in India as well.
The idea of an MRP model was suggested in a 1997 research article by Professor Andrew Gelman of Columbia University, and Thomas C Little of Morgan Stanley Dean Witter.
Let's see how it can be implemented in the Delhi assembly election, for example.
First, 7,000 samples may be taken from the whole state, at random. In contrast to the traditional opinion polls, there is no need to maintain the population proportions of different socio-economic-religious parameters in the sample.
Also, there is no need to pay attention to how many individuals are from which constituency.
However, several important socio-economic-educational-religious parameters are also recorded for the individuals in the sample, in addition to their voting intentions.
This data is then used to frame a statistical relationship which will represent the 'probabilities of voting for different parties' as functions of some important socio-economic-educational-religious parameters.
The model will be such that, when the gender, age group, educational status, economic status, religion and caste of an individual is provided in the model, it will offer the chances (probabilities) of voting for the AAP, the BJP, the INC or Others, for that person.
These voting probabilities will change with the change in these socio-economic statuses. The choice of an appropriate relationship model is important and that should be done with utmost care and with top-level expertise.
Now consider any constituency -- say, Laxmi Nagar in East Delhi. From different registers, it is easy to find the socio-economic statuses of the voters of this constituency.
For example, in the case of the UK election, data from the UK Office of National Statistics, the British Election Study, and past election results were used.
Similarly, from past data it's not difficult to estimate that about 1,65,000-1,70,000 voters are expected to cast their votes in this constituency in 2020.
From the data of the last three assembly elections, one can easily estimate the percentages of votes cast by different social, religious and economic groups.
Then, the MRP model for Delhi might come into play. One can obtain the probabilities of each of the 1,70,000 expected voters voting in favour of the AAP, the BJP, the INC and Others in the coming election.
By adding these 1,70,000 probability-values for each party in that constituency, the expected total number of votes favouring that party can be obtained.
Consequently, a prediction for the winner for this constituency can be made. The same MRP model can be used for other constituencies as well, using previous election data and data from different registers for those constituencies.
Is any polling organisation using such a model for the upcoming Delhi election? Careful implementation of such sophisticated statistical models will enhance the credibility of opinion polls, for sure.
Atanu Biswas is professor of Statistics, Indian Statistical Institute, Kolkata.