
Global housing markets are gaining traction as average prices in the third quarter of 2013 increase by 1.5 per cent, according to Knight Frank Global House Price Index.
More than 69 per cent of the countries tracked by the index recorded positive price growth in the year to September, two years earlier this figure was closer to 55 per cent, it said.
Let's take a look at some of the markets that saw biggest increase in residential property prices.
Source: Knight Frank Global House Price Index
...

Dubai, United Arab Emirates
Change in prices in 12-month period: 28.5 per cent in Q3 2012-Q3 2013
Change in prices in 6-month period: 11.8 per cent in Q1 2013-Q3 2013
Change in prices in 3-month period: 4.5 per cent in Q2 2013-Q3 2013
Overall rank in change in residential property prices: 1
Dubai, which is one of the biggest trade and tourism hubs in the world, is witnessing an impressive rebound in the housing market after the post-2008 crash.
...

China
Change in prices in 12-month period: 21.6 per cent in Q3 2012-Q3 2013
Change in prices in 6-month period: 9.7 per cent in Q1 2013-Q3 2013
Change in prices in 3-month period: 5.5 per cent in Q2 2013-Q3 2013
Overall rank in change in residential property prices: 2
China, which is the fastest growing economy in the world, is trying to cool its property market, but, as the index shows, its efforts are not having much impact.
...

Hong Kong
Change in prices in 12-month period: 16.1 per cent in Q3 2012-Q3 2013
Change in prices in 6-month period: 3.4 per cent in Q1 2013-Q3 2013
Change in prices in 3-month period: 1.8 per cent in Q2 2013-Q3 2013
Overall rank in change in residential property prices: 3
Hong Kong, which has a per capita income of $52,687, saw 16 per cent increase in house prices.
...

Taiwan
Change in prices in 12-month period: 15.4 per cent in Q3 2012-Q3 2013
Change in prices in 6-month period: 11.9 per cent in Q1 2013-Q3 2013
Change in prices in 3-month period: 7.4 per cent in Q2 2013-Q3 2013
Overall rank in change in residential property prices: 4
Taiwan, which has a per capita income of $39,580, saw more than 15 per cent increase in house prices.
...
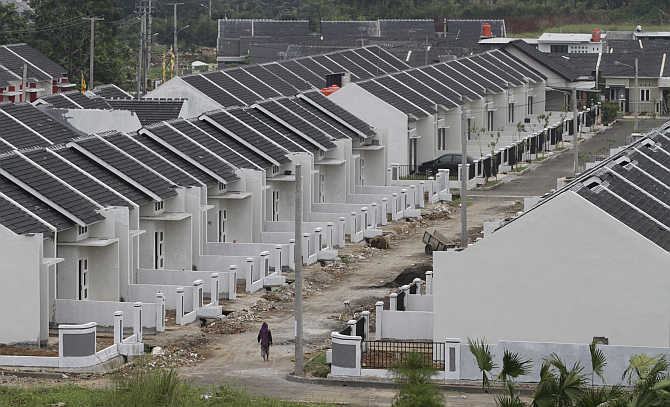
Indonesia
Change in prices in 12-month period: 13.5 per cent in Q3 2012-Q3 2013
Change in prices in 6-month period: 4.5 per cent in Q1 2013-Q3 2013
Change in prices in 3-month period: 2.3 per cent in Q2 2013-Q3 2013
Overall rank in change in residential property prices: 5
Indonesia, which has a per capita income of $5,182, saw more than 13 per cent increase in house prices.
...
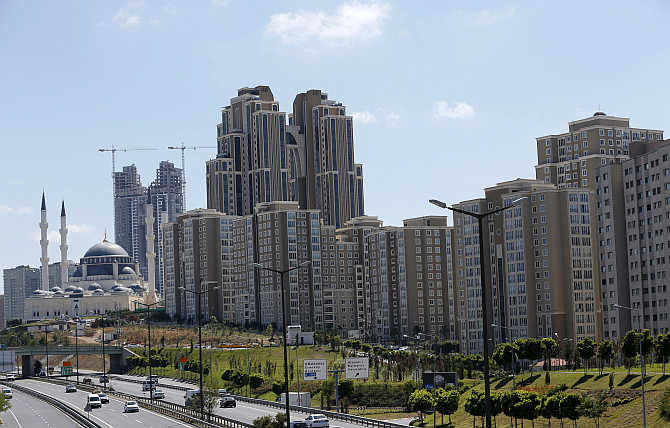
Turkey
Change in prices in 12-month period: 12.5 per cent in Q3 2012-Q3 2013
Change in prices in 6-month period: 7.7 per cent in Q1 2013-Q3 2013
Change in prices in 3-month period: 3.8 per cent in Q2 2013-Q3 2013
Overall rank in change in residential property prices: 6
Turkey, which has a per capita income of $18,348, saw more than 12 per cent increase in house prices.
...

Brazil
Change in prices in 12-month period: 11.9 per cent in Q3 2012-Q3 2013
Change in prices in 6-month period: 6.1 per cent in Q1 2013-Q3 2013
Change in prices in 3-month period: 3.0 per cent in Q2 2013-Q3 2013
Overall rank in change in residential property prices: 7
Brazil, which has a per capita income of $12,118, saw nearly 12 per cent increase in house prices.
...

Colombia
Change in prices in 12-month period: 11.8 per cent in Q3 2012-Q3 2013
Change in prices in 6-month period: 5.9 per cent in Q1 2013-Q3 2013
Change in prices in 3-month period: 2.7 per cent in Q2 2013-Q3 2013
Overall rank in change in residential property prices: 8
Colombia, which has a per capita income of $10,791, saw 11.8 per cent increase in house prices.
...

Germany
Change in prices in 12-month period: 11.2 per cent in Q3 2012-Q3 2013
Change in prices in 6-month period: 9.8 per cent in Q1 2013-Q3 2013
Change in prices in 3-month period: 4.9 per cent in Q2 2013-Q3 2013
Overall rank in change in residential property prices: 9
Germany, which has a per capita income of $39,468, saw 11.2 per cent increase in house prices.
...

United States
Change in prices in 12-month period: 11.2 per cent in Q3 2012-Q3 2013
Change in prices in 6-month period: 10.5 per cent in Q1 2013-Q3 2013
Change in prices in 3-month period: 3.2 per cent in Q2 2013-Q3 2013
Overall rank in change in residential property prices: 10
United States, which has a per capita income of $52,839, saw 11.2 per cent increase in house prices.
...

Ukraine
Change in prices in 12-month period: 10.9 per cent in Q3 2012-Q3 2013
Change in prices in 6-month period: 4.0 per cent in Q1 2013-Q3 2013
Change in prices in 3-month period: 2.3 per cent in Q2 2013-Q3 2013
Overall rank in change in residential property prices: 11
Ukraine, which has a per capita income of $7,422, saw 10.9 per cent increase in house prices.
...

Malaysia
Change in prices in 12-month period: 10.2 per cent in Q3 2012-Q3 2013
Change in prices in 6-month period: 5.1 per cent in Q1 2013-Q3 2013
Change in prices in 3-month period: 1.3 per cent in Q2 2013-Q3 2013
Overall rank in change in residential property prices: 12
Malaysia, which has a per capita income of $17,675, saw 10.2 per cent increase in house prices.
...

South Africa
Change in prices in 12-month period: 8.6 per cent in Q3 2012-Q3 2013
Change in prices in 6-month period: 3.1 per cent in Q1 2013-Q3 2013
Change in prices in 3-month period: 1.4 per cent in Q2 2013-Q3 2013
Overall rank in change in residential property prices: 13
South Africa, which has a per capita income of $11,525, saw 8.6 per cent increase in house prices.
...

Estonia
Change in prices in 12-month period: 8.4 per cent in Q3 2012-Q3 2013
Change in prices in 6-month period: 4.5 per cent in Q1 2013-Q3 2013
Change in prices in 3-month period: -0.6 per cent in Q2 2013-Q3 2013
Overall rank in change in residential property prices: 14
Estonia, which has a per capita income of $22,351, saw 8.4 per cent increase in house prices.
...

Australia
Change in prices in 12-month period: 7.6 per cent in Q3 2012-Q3 2013
Change in prices in 6-month period: 4.6 per cent in Q1 2013-Q3 2013
Change in prices in 3-month period: 1.9 per cent in Q2 2013-Q3 2013
Overall rank in change in residential property prices: 15
Australia, which has a per capita income of $43,042, saw 7.6 per cent increase in house prices.
...

Denmark
Change in prices in 12-month period: 7.4 per cent in Q3 2012-Q3 2013
Change in prices in 6-month period: 4.8 per cent in Q1 2013-Q3 2013
Change in prices in 3-month period: 3.3 per cent in Q2 2013-Q3 2013
Overall rank in change in residential property prices: 16
Denmark, which has a per capita income of $37,657, saw 7.4 per cent increase in house prices.
...

Israel
Change in prices in 12-month period: 7.4 per cent in Q3 2012-Q3 2013
Change in prices in 6-month period: 2.2 per cent in Q1 2013-Q3 2013
Change in prices in 3-month period: 2.4 per cent in Q2 2013-Q3 2013
Overall rank in change in residential property prices: 17
Israel, which has a per capita income of $34,875, saw 7.4 per cent increase in house prices.
...
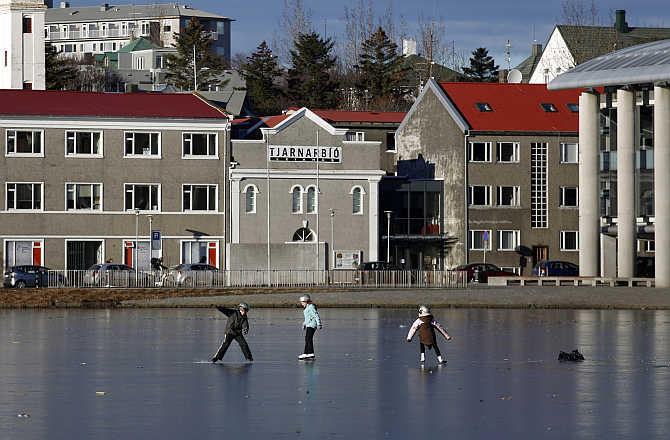
Iceland
Change in prices in 12-month period: 6.0 per cent in Q3 2012-Q3 2013
Change in prices in 6-month period: 5.2 per cent in Q1 2013-Q3 2013
Change in prices in 3-month period: 1.8 per cent in Q2 2013-Q3 2013
Overall rank in change in residential property prices: 18
Iceland, which has a per capita income of $39,223, saw 6.0 per cent increase in house prices.
...

India
Change in prices in 12-month period: 5.9 per cent in Q3 2012-Q3 2013
Change in prices in 6-month period: -0.1 per cent in Q1 2013-Q3 2013
Change in prices in 3-month period: -1.7 per cent in Q2 2013-Q3 2013
Overall rank in change in residential property prices: 19
India, which has a per capita income of $3,991, saw 5.9 per cent increase in house prices.
...

Russia
Change in prices in 12-month period: 5.2 per cent in Q3 2012-Q3 2013
Change in prices in 6-month period: 2.4 per cent in Q1 2013-Q3 2013
Change in prices in 3-month period: 1.3 per cent in Q2 2013-Q3 2013
Overall rank in change in residential property prices: 20
Russia, which has a per capita income of $18,083, saw 5.2 per cent increase in house prices.
...

Austria
Change in prices in 12-month period: 5.0 per cent in Q3 2012-Q3 2013
Change in prices in 6-month period: 3.5 per cent in Q1 2013-Q3 2013
Change in prices in 3-month period: 1.6 per cent in Q2 2013-Q3 2013
Overall rank in change in residential property prices: 21
Austria, which has a per capita income of $42,408, saw 5.0 per cent increase in house prices.
...

Luxembourg
Change in prices in 12-month period: 4.9 per cent in Q3 2012-Q3 2013
Change in prices in 6-month period: 4.5 per cent in Q1 2013-Q3 2013
Change in prices in 3-month period: 1.2 per cent in Q2 2013-Q3 2013
Overall rank in change in residential property prices: 22
Luxembourg, which has a per capita income of $79,785, saw 4.9 per cent increase in house prices.
...

Singapore
Change in prices in 12-month period: 4.6 per cent in Q3 2012-Q3 2013
Change in prices in 6-month period: 2.0 per cent in Q1 2013-Q3 2013
Change in prices in 3-month period: 0.6 per cent in Q2 2013-Q3 2013
Overall rank in change in residential property prices: 23
Singapore, which has a per capita income of $61,046, saw 4.6 per cent increase in house prices.
...

Mexico
Change in prices in 12-month period: 4.4 per cent in Q3 2012-Q3 2013
Change in prices in 6-month period: 3.2 per cent in Q1 2013-Q3 2013
Change in prices in 3-month period: 0.9 per cent in Q2 2013-Q3 2013
Overall rank in change in residential property prices: 24
Mexico, which has a per capita income of $15,608, saw 4.4 per cent increase in house prices.
...

United Kingdom
Change in prices in 12-month period: 4.3 per cent in Q3 2012-Q3 2013
Change in prices in 6-month period: 4.8 per cent in Q1 2013-Q3 2013
Change in prices in 3-month period: 2.2 per cent in Q2 2013-Q3 2013
Overall rank in change in residential property prices: 25
United Kingdom, which has a per capita income of $37,299, saw 4.3 per cent increase in house prices.
...

Ireland
Change in prices in 12-month period: 3.6 per cent in Q3 2012-Q3 2013
Change in prices in 6-month period: 6.4 per cent in Q1 2013-Q3 2013
Change in prices in 3-month period: 4.0 per cent in Q2 2013-Q3 2013
Overall rank in change in residential property prices: 26
Ireland, which has a per capita income of $43,592, saw 3.6 per cent increase in house prices.
...

Switzerland
Change in prices in 12-month period: 3.2 per cent in Q3 2012-Q3 2013
Change in prices in 6-month period: 1.2 per cent in Q1 2013-Q3 2013
Change in prices in 3-month period: 0.8 per cent in Q2 2013-Q3 2013
Overall rank in change in residential property prices: 27
Switzerland, which has a per capita income of $45,999, saw 3.2 per cent increase in house prices.
...

Sweden
Change in prices in 12-month period: 3.2 per cent in Q3 2012-Q3 2013
Change in prices in 6-month period: 3.2 per cent in Q1 2013-Q3 2013
Change in prices in 3-month period: 1.6 per cent in Q2 2013-Q3 2013
Overall rank in change in residential property prices: 28
Sweden, which has a per capita income of $40,870, saw 3.2 per cent increase in house prices.
...

Norway
Change in prices in 12-month period: 2.9 per cent in Q3 2012-Q3 2013
Change in prices in 6-month period: 0.8 per cent in Q1 2013-Q3 2013
Change in prices in 3-month period: -1.8 per cent in Q2 2013-Q3 2013
Overall rank in change in residential property prices: 29
Norway, which has a per capita income of $55,398, saw 2.9 per cent increase in house prices.