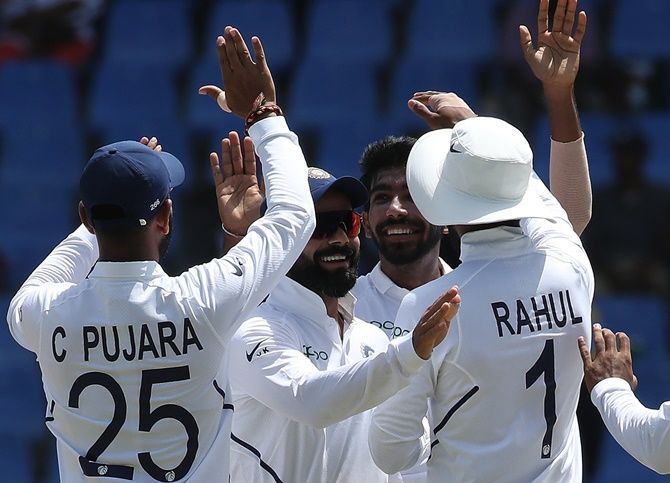
IMAGE: Virat Kohli celebrates with Ravichandran Ashwin. Photograph: BCCI
ICC World Test Championship Points Table:
| Team | PCT (Percentage of points) | Series Played | Matches played | Won | Tied | Draw | Lost | Points |
|---|---|---|---|---|---|---|---|---|
| India (Q) | 72.2 | 6 | 17 | 12 | 0 | 1 | 4 | 520 |
| New Zealand (Q) | 70.0 | 5 | 11 | 7 | 0 | 0 | 4 | 420 |
| Australia | 69.2 | 4 | 14 | 8 | 0 | 2 | 4 | 332 |
| England | 61.4 | 6 | 21 | 11 | 0 | 3 | 7 | 442 |
| Pakistan | 43.3 | 5.5 | 12 | 4 | 0 | 3 | 5 | 286 |
| West Indies | 33.3 | 4 | 9 | 3 | 0 | 0 | 6 | 160 |
| South Africa | 30.0 | 4 | 11 | 3 | 0 | 0 | 8 | 144 |
| Sri Lanka | 16.7 | 4 | 8 | 1 | 0 | 1 | 6 | 80 |
| Bangladesh | 00.0 | 2.5 | 5 | 0 | 0 | 0 | 5 | 0 |
(Q = India and New Zealand qualify for the World Test Championship final to be played at Lord's from June 18 to 22)
(Teams are ranked on basis of PCT, which is the percentage of points won out of the total number of points contested by each team.)
Distribution of points in ICC World Test Championship
| Matches in series | Points for a win | Points for a tie | Points for a draw | Points for a defeat |
|---|---|---|---|---|
| 2 | 60 | 30 | 20 | 0 |
| 3 | 40 | 20 | 13 | 0 |
| 4 | 30 | 15 | 10 | 0 |
| 5 | 24 | 12 | 8 | 0 |