
The Indian market is the second worst performing, followed by Brazil, among major global markets so far in 2013.
Both nations' performance in dollar terms is even worse, thanks to a more than 15 per cent slide in their respective currencies against the dollar.
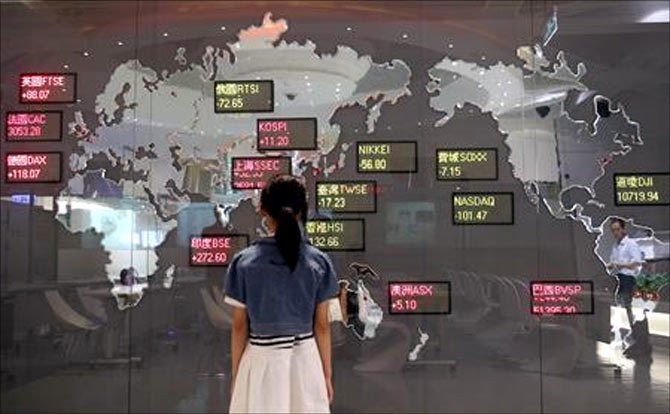
Take a look at the world’s worst performing markets…
…

Bovespa (Brazil)
Index level: 51,429
Performance between January 1 to Aug 27
Local currency: -15.6%
In dollar terms: -28.3%
(Data: Bloomberg)

Nifty (India)
Index level: 5,287
Performance between January 1 to Aug 27
Local currency: -10.5%
In dollar terms: -24.8%
…
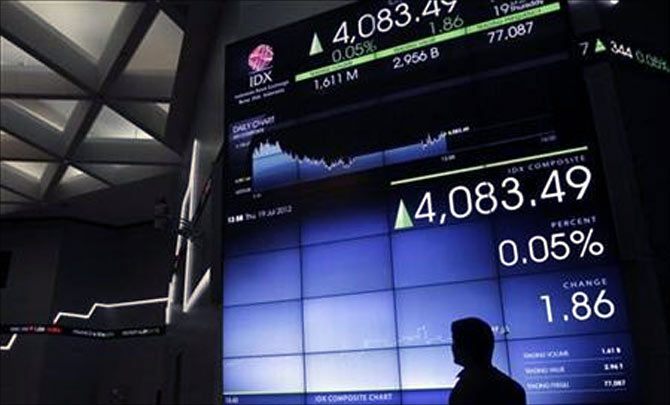
Jakarta Composite (Indonesia)
Index level: 3,968
Performance between January 1 to Aug 27
Local currency: -8.1%
In dollar terms: -21.7%
…

MICEX (Russia)
Index level: 1,374
Performance between January 1 to Aug 27
Local currency: -6.9%
In dollar terms: -14.3%
…
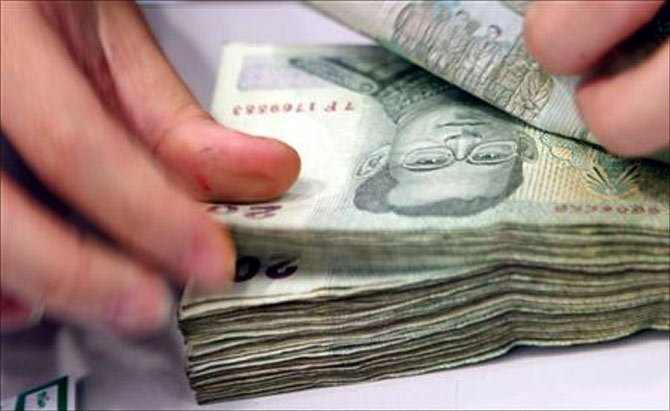
SE Thai (Thailand)
Index level: 1,294
Performance between January 1 to Aug 27
Local currency: -7.0%
In dollar terms: -11.7%
…

Kospi (South Korea)
Index level: 1,886
Performance between January 1 to Aug 27
Local currency: -5.6%
In dollar terms: -10.2%
…
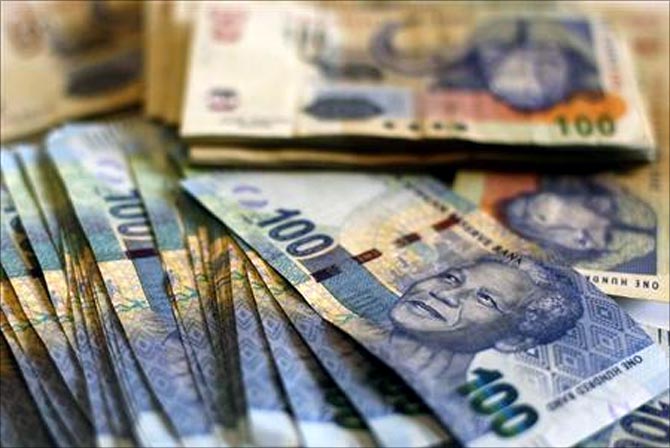
FTSE T40 (South Africa)
Index level: 38668
Performance between January 1 to Aug 27
Local currency: 11%
In dollar terms: -10.0%
…

Straits Times (Singapore)
Index level: 3,034
Performance between January 1 to Aug 27
Local currency: -4.2%
In dollar terms: -9.0%
…

PSEi (Philippines)
Index level: 5,920
Performance between January 1 to Aug 27
Local currency: 1.8 %
In dollar terms: -6.3%
…
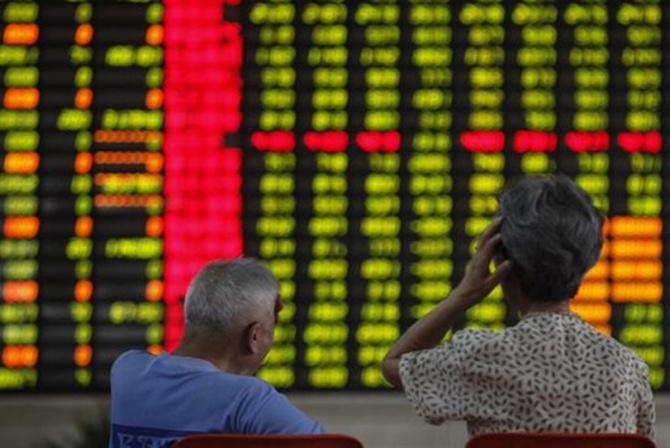
Shanghai Composite (China)
Index level: 2,103
Performance between January 1 to Aug 27
Local currency: -7.3 %
In dollar terms: -5.6%
…
Taiex (Taiwan)
Index level: 7,820
Performance between January 1 to Aug 27
Local currency: 1.6 %
In dollar terms: -1.7%