Among manufacturing companies that went to the National Company Law Tribunal (NCLT), chemicals and metal firms witnessed more resolutions while companies in the labour intensive (employment friendly) leather and textile sectors mostly get liquidated, reports Abhishek Waghmare.
Illustration: Dominic Xavier/Rediff.com
The Insolvency and Bankruptcy Code (IBC) has completed more than three years in operation, and the data is available now.
An analysis of the Insolvency and Bankruptcy Board of India (IBBI) data gives insights into how the system has evolved.
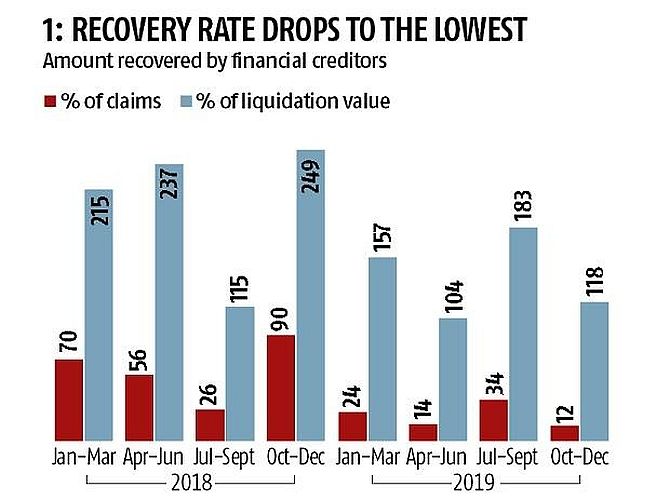
The amount recovered by financial creditors has varied, and does not show a clear improvement.
In fact, the recovery rate was just 12 per cent in the quarter ending December 2019, the lowest in at least two years (Chart 1).
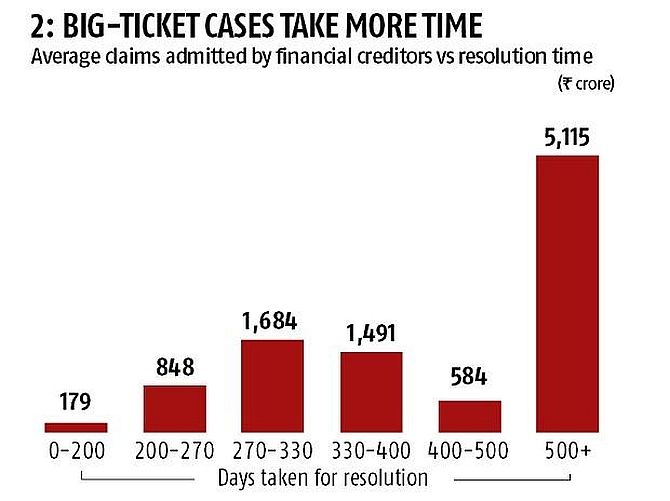
Further, the IBBI data processed by EY India shows that bigger cases -- with higher claims by financial creditors -- take more time to get resolved (Chart 2).
Also, the average recovery rate rises with time, but only till the upper limit of 330 days (Chart 3).
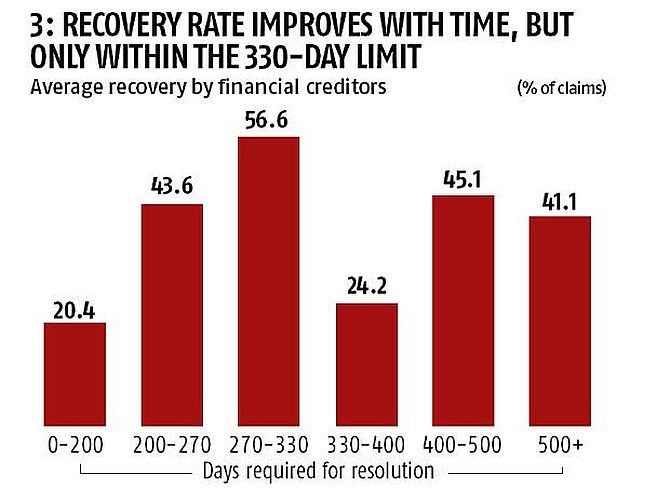
After the 330-day period, there is no clear trend as to how fast or efficiently the cases get resolved, aside from this important fact: The most delayed cases are the ones with the higher claims.
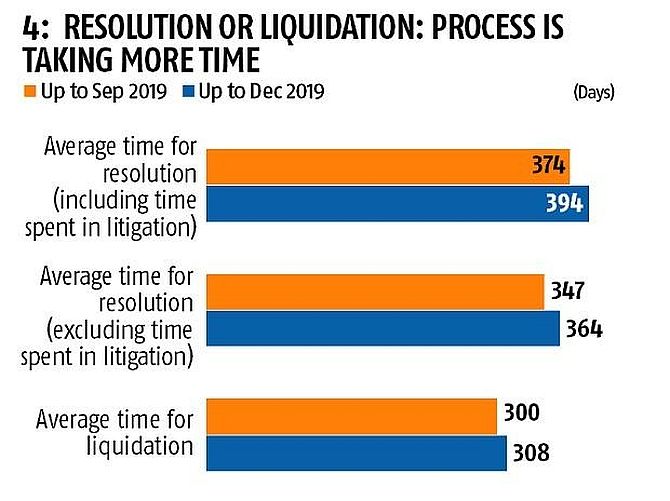
Due to such cases, the average time taken for resolution, and even liquidation, is slowly rising (Chart 4).
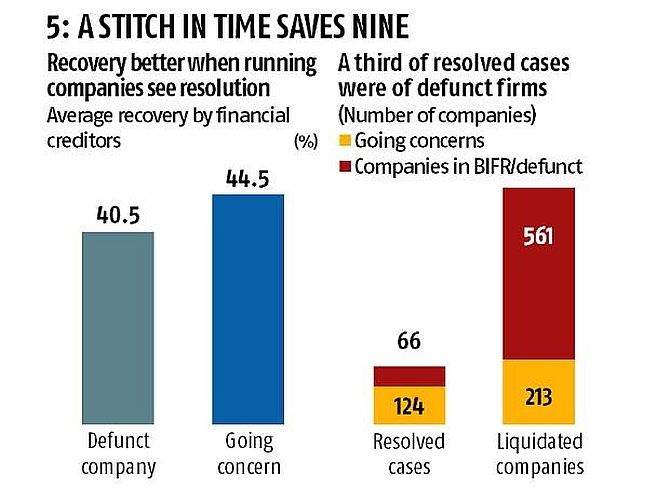
The data also shows that it is better to admit a company in the IBC process while its in operation, as the recovery rate is better.
A third of the companies not resulting in resolution were already defunct (Chart 5).
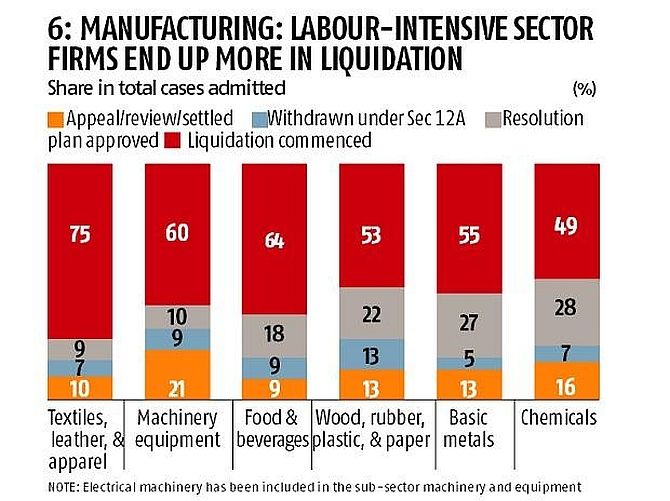
Among manufacturing companies that went to the National Company Law Tribunal (NCLT), chemicals and metal firms witnessed more resolutions.
Companies in the labour intensive (employment friendly) leather and textile sectors mostly get liquidated (Chart 6).
In services, companies in the real estate and construction sector go for appeal or review the most (Chart 7).
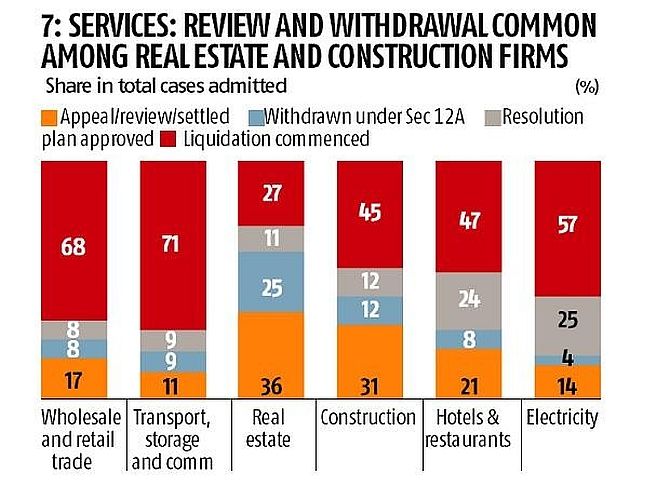
A resolution is more likely in the power and hospitality sector companies.
Source: IBBI, EY India, Compiled by BS Research Bureau.