A lot of gains have been driven by foreign portfolio investors. Lower interest rates globally have forced foreign investors to seek avenues for growth. They have been net buyers to the tune of Rs 2.5 trillion over the trailing 12 months, including May, reports Sachin P Mampatta.

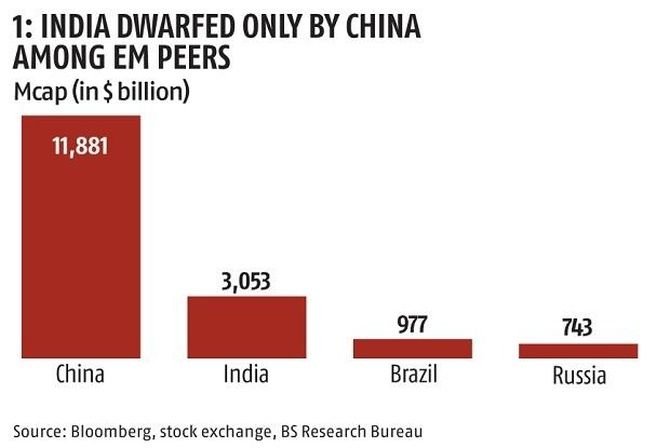
A sharp rise in the stock market during the pandemic has helped fuel India's entry into the $3 trillion-plus market capitalisation club.
India now has the eighth most valuable stock market in the world.
It is also the second most valuable among emerging markets (chart 1).
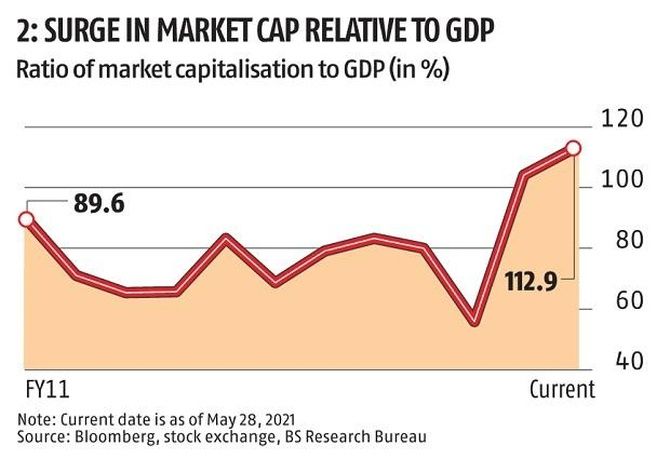
The ratio of the value of all companies in the stock market to the size of the Indian economy is now in excess of 100 per cent.
This is partly driven by the economy itself shrinking due to the pandemic.
The ratio was closer to 80 per cent at the end of the financial year 2018-19 (chart 2).
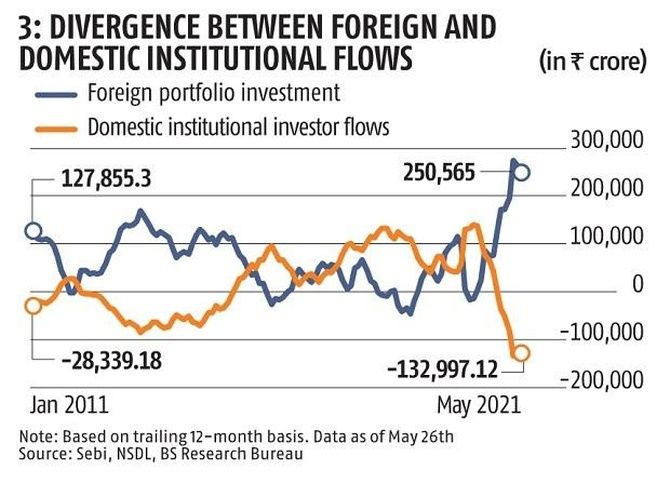
A lot of gains have been driven by foreign portfolio investors.
Lower interest rates globally have forced foreign investors to seek avenues for growth.
They have been net buyers to the tune of Rs 2.5 trillion over the trailing 12 months, including May.
Domestic institutional investors have been net sellers during the same period to the tune of around Rs 1.3 trillion.
Some selling has been driven by people tapping savings.
Others have opted to go for the direct route rather than pool their investments through an institution (chart 3).
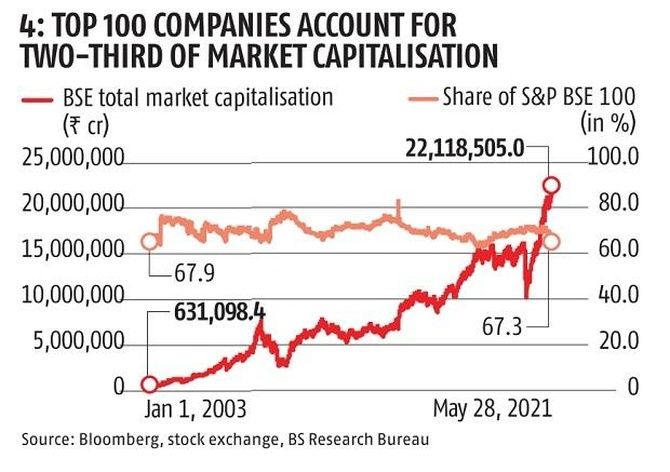
One thing that has remained more or less constant is the share of the top 100 companies even as India's share market surged over the years.
They account for close to 67 per cent of the total market capitalisation of around 4,000 BSE-listed companies (chart 4).
Interestingly, recent data may point to a continuance of the trend.
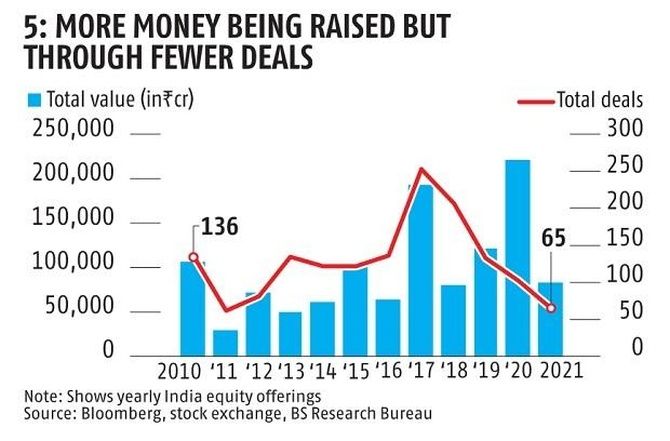
The amount of money raised went up from Rs 1.2 trillion in 2019 to Rs 2.2 trillion in 2020.
But the number of equity deals actually went down during the same period, suggesting more money is going to fewer companies with a larger average deal size (chart 5).
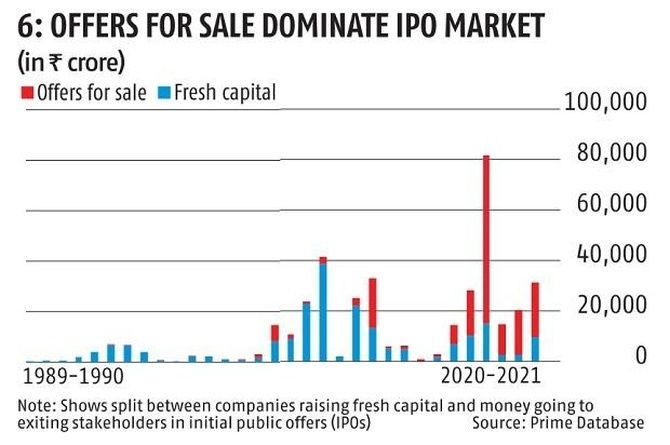
The nature of fund-raising has also changed.
A smaller share of initial public offer (IPO) capital is going to companies raising money for their needs through the issue of new shares.
Most of the capital is going to existing shareholders who are selling stake through the IPO.
This may reflect fewer opportunities for investment in the economy amid falling demand (chart 6).
Feature Presentation: Rajesh Alva/Rediff.com