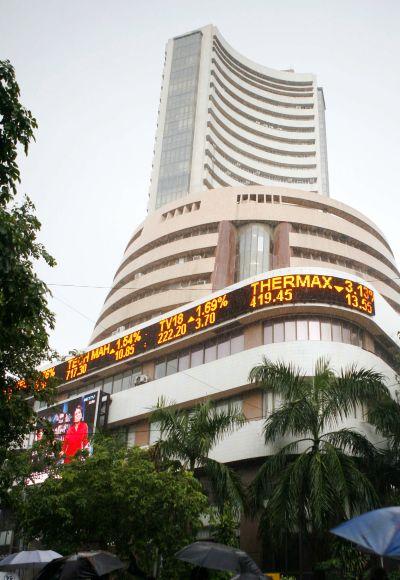
The Bombay Stocks Exchange S&P BSE Sensex plunged by over 750 points, or 4%, its biggest fall in four years, to end at 18,598 on fear that the roll-back of US stimulus could spark selling pressure by the overseas investors in the equity space.
The stock markets were also under heavy pressure after the rupee touched a lifetime low of 62.01 against the dollar in morning deals.
It was the Sensex’s biggest single-day fall since July 2009. Across market, around 1,583 stocks fell and just 729 rose. Investor wealth worth Rs 221,268 lakh crore was eroded in today's fall.
The four BSE sectoral indices -- consumer durables, realty, metal and bankex plunged more than 5% each, while capital goods, oil and gas, power and fast moving consumer goods (FMCG) were down between 4-5%.
Bharat Heavy Electrical Limited, YES Bank, Reliance Communications, Titan Industries, Jaiprakash Associates, BF Utilities, Ruchi Soya Industries and Punj Lloyd tanked over 10% each.
Markets fell sharply on continuing concerns over the depreciating rupee and tapering of the monetary stimulus by US Fed, says Dipen Shah, Head of Private Client Group Research, Kotak Securities.
BHEL tanked nearly 11% to Rs 106, its lowest level since October 2005, on concerns of slowdown in economy may drag their net profit growth further.
Axis Bank lost 8% at Rs 1,055 after MSCI said it would exclude the stock from its standard and large cap indices with effect from 2 September, 2013.
The broad-based National Stock Exchange index Nifty dipped below the levels of 5,550, losing 234 points, or 4%, to close at 5,507.85.
. . .
TOP FIVE FALLS
17,605, 21 January 2008: The Sensex saw its highest ever loss of 1,408 points at the end of the session on Monday. The Sensex recovered to close at 17,605.40 after it tumbled to the day's low of 16,963.96, on high volatility as investors panicked following weak global cues amid fears of the US recession.
8,701, 24 October 2008: The Sensex lost 10.96% of its value (1070.63 points) in intra-day trade, closing at 8,701.07, for its first close below the 9,000 mark since 14 June 2006, after RBI lowered its GDP growth forecasts on global economic concerns. The loss was the 2nd highest in terms of total points, and the 3rd highest percentage-wise, for a one day period in the index's history.
14,810, 17 March 2008 - The Sensex dropped by 951.03 points on the global credit crisis and distress, to fall below the 15,000 mark, closing at 14,810.The month ended with the Sensex shedding 726.85 points on 31 March 2008, after heavy selling in blue-chip stocks on global economic fears.
16,678, 3 March 2008 - The Sensex lost 901 points on concerns emanating from growing credit losses in the US. This was the first of four one-day falls of greater than 700 points during the month.
16,730, 22 January 2008 - The Sensex lost 875 points on high volatility as investors panicked following weak global cues amid fears of a recession in the US.
. . .
| Top biggest falls in Sensex history | ||||
| Date | S&P BSE-Sensex | Change | CNX Nifty | Change |
| 21/01/2008 | 17605.35 | -1408.35 | 5208.80 | -496.50 |
| 24/10/2008 | 8701.07 | -1070.63 | 2584.00 | -359.15 |
| 17/03/2008 | 14809.49 | -951.03 | 4503.10 | -242.70 |
| 03/03/2008 | 16677.88 | -900.84 | 4953.00 | -270.50 |
| 22/01/2008 | 16729.94 | -875.41 | 4899.30 | -309.50 |
| 06/07/2009 | 14043.40 | -869.65 | 4165.70 | -258.55 |
| 11/02/2008 | 16630.91 | -833.98 | 4857.00 | -263.35 |
| 18/05/2006 | 11391.43 | -826.38 | 3388.90 | -246.20 |
| 10/10/2008 | 10527.85 | -800.51 | 3279.95 | -233.70 |
| 13/03/2008 | 15357.35 | -770.63 | 4623.60 | -248.40 |
| 17/12/2007 | 19261.35 | -769.48 | 5777.00 | -270.70 |
| 16/08/2013 | 18598.18 | -769.41 | 5507.85 | -234.45 |