NIFTY appears determined to retest the break point as support, which is a healthy sign -- provided it holds. Should it do so, NIFTY too will join the other markets to reach for new highs, says Sonali Ranade
Major Asian markets make steady progress towards breakout points from all-time lows. EU markets are in fine fettle even as the euro continues its phenomenal rally. The midcap space in the US is on fire, indicating a bullish sentiment. And the S&P 500 continues to make new highs.
NIFTY continued in its corrective mode after breaking above 5950. It appears determined to retest the break point as support, which is a healthy sign -- provided it holds. Should it do so, NIFTY too will join the other markets to reach for new highs.
In the currency markets yen continued to depreciate relentlessly against the dollar and the euro, while the dollar itself continued to correct down to 79 levels and could go lower. Weakening currencies help inflate asset values and that’s being translated into market prices. The INR was an expansion as it actually appreciated against the dollar. The dollar could be headed towards 51.
Commodities are showing a mixed trend. Precious metals continue to correct. Copper could be headed for a breakout while crude appears to have broken out of a corrective pattern. An appreciating rupee and higher crude prices are not exactly bullish for India, but then the markets have a mind of their own!
Caution is warranted. While the indices have both time and momentum on their side, predicting when they will turn is hazardous business. We are in very mature bull markets in equities. They can turn on a dime with little notice. So protect profits with sliding stop losses.
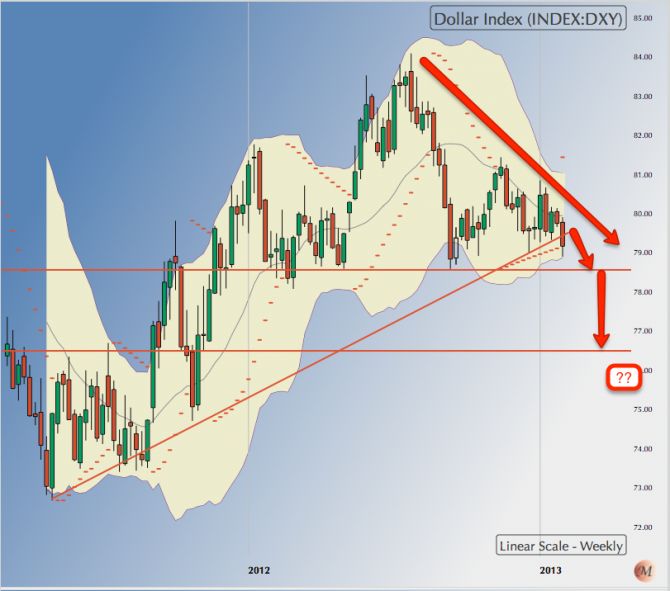 |
US Dollar: The dollar closed the week at 79.135 after making a low of 78.915.
The dollar has been correcting down from its July top of 84.25 for the last six months. The correction had a logical target 78.50 followed by a deeper target of 76.50.
The dollar’s correction is nearing its end but it is not yet over. 78.50 is a major support for the dollar and breach of that would open the way for 78 followed by 76.50. There is still room for both to happen before the correction concludes.
In the longer term, remain bullish in the dollar. The correct correction could run on until April.
|
| |
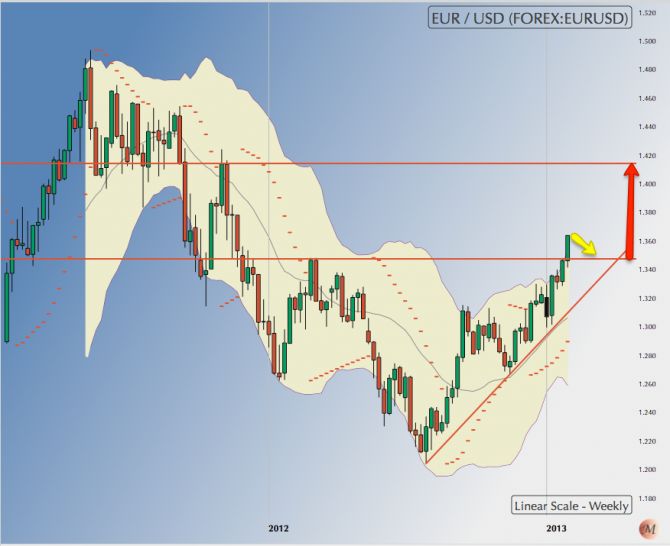 |
EURUSD: It closed the week at 1.3639 after a breathtaking rally. The currency pair is over-bought and over-stretched, but the long-term rally is far from over.
EURUSD needs to consolidate and digest its gains. The 1.35 level now becomes a very important support and EURUSD could consolidate and 1.3450 for a few weeks before heading higher.
The logical long-term target for this rally now is 1.4250 and the euro has both time and momentum to get there. But first expect a few weeks of consolidation.
|
| |
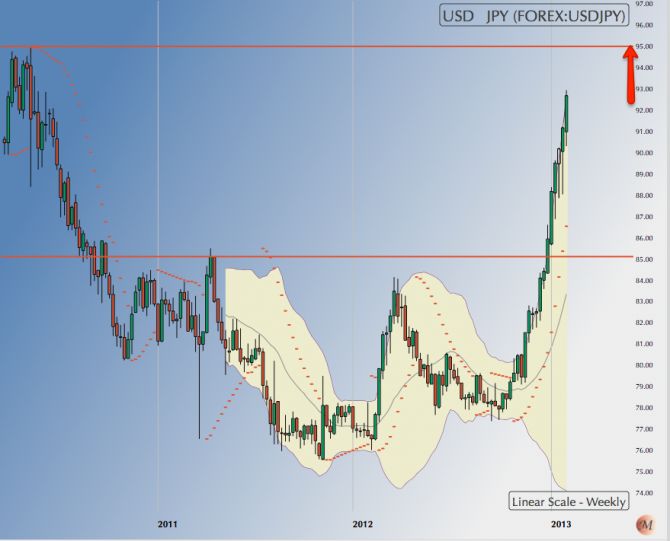 |
USDJPY: Another spectacular salvo from the yen in the ongoing currency wars. The yen closed the week at 92.72.
The logical target for the yen for this rally was 95. It has both time and space to achieve its target.
Obviously, the yen is both over-bought and over-stretched. Besides, it is a policy driven movement that is difficult to read from charts and price action.
Having said that, barring the occasional running correction, yen looks set to hit just under 95 before going in for a consolidation.
|
| |
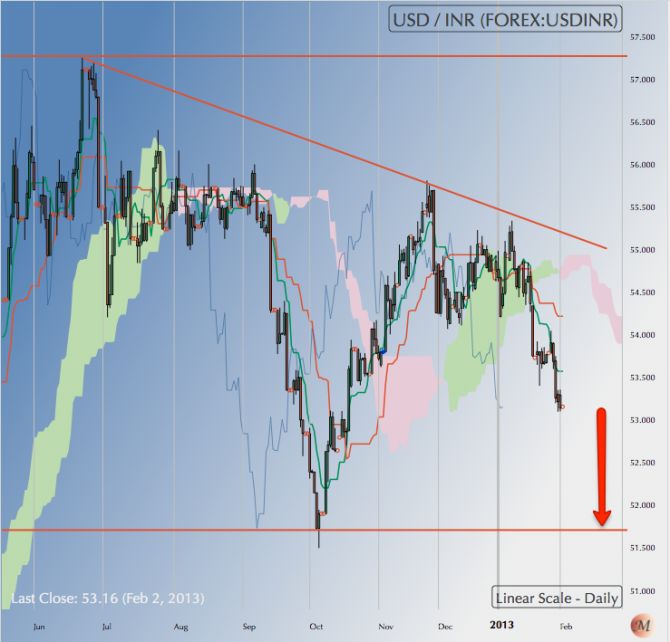 |
USDINR: The USDINR closed the week at 53.1550, decisively violating the up-trend-line from July 2011 that I have tracked. Furthermore, the pair closed below its 50 and 200 DMA, both of which are in the 54.65 region. Last but not least, the 50 DMA crossed below the 200 DMA, signaling a long-term bearish phase in the $ vs INR.
That puts the USD right in the middle of the first leg down of a Wave III with a logical target of 51.35 by the middle of May this year. To my mind, that’s not a good thing for the young college grads of India as it scuppers their jobs and the main engine of India’s growth. But who is to tell RBI?
|
| |
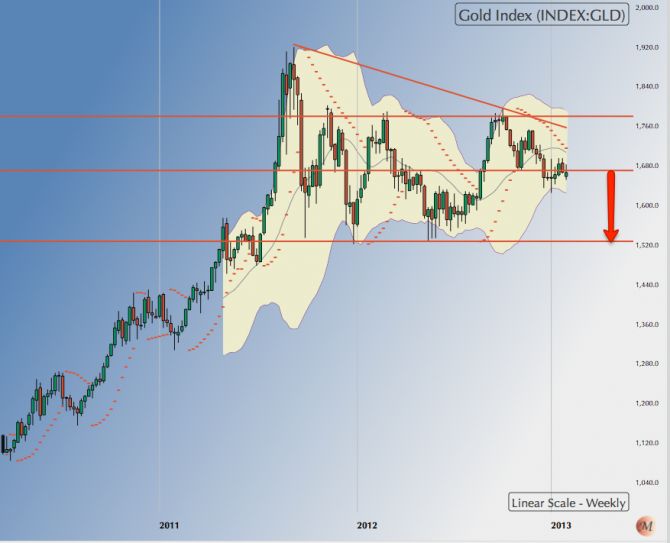 |
Gold: Gold closed the week at $1662, more or less on its 200 DMA. Gold should have been in the middle of a ripping bear rally but instead exhibited serious weakness in price action over the last two weeks.
That leads me to believe that gold will now put in a bottom before looking up again. Gold’s first target now is 1620 followed by a retest of 1525 by March-end.
|
| |
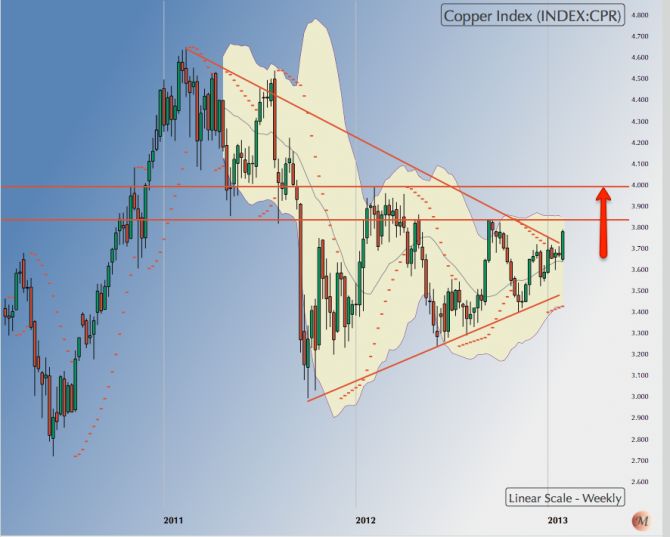 |
Copper: Copper closed the week at 3.7845 and broke above the well-defined resistance of 3.75 on the charts. That is bullish but caution is warranted.
Firstly copper has multiple overhead resistances spanning from 3.75 to 3.85. Until copper clears the 3.85 level I would be wary of treating the breakout seriously. Secondly, the “breakout” comes at point where you expect some false signals and hence is suspect.
Maintain a neutral stand on the metal till the situation is resolved either way.
|
| |
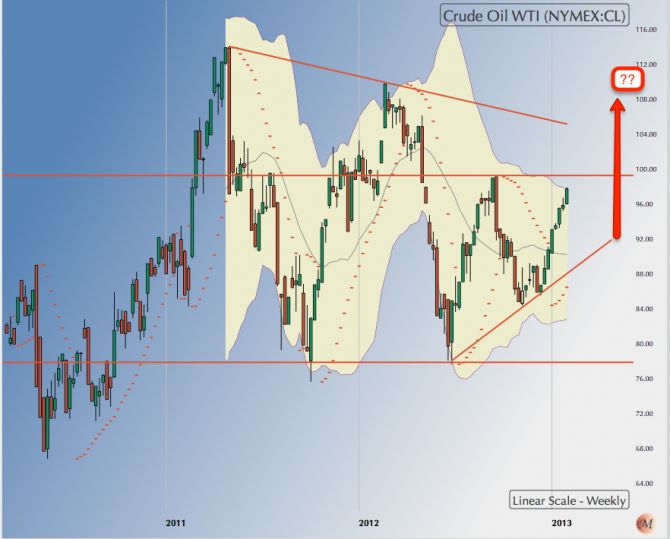 |
WTI Crude: Crude closed the week at $97.77, just below its major overhead resistance at $98.
Crude could consolidate for a week or more just below 98 before attempting to take out the overhead resistance. A break above 98 would not only end all doubts about crude’s future intentions but also open the way to a rally to $110.
|
| |
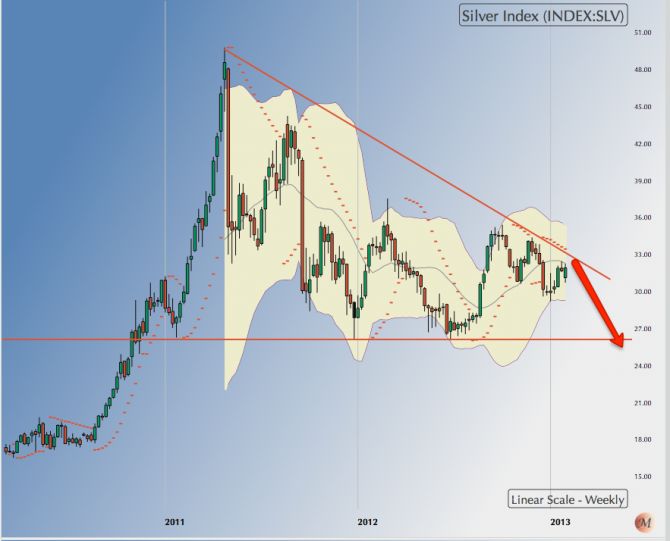 |
Silver: Silver closed the week at $31.958.
Silver now enters an area where the price collapse could be fairly rapid and unpredictable. The target remains $26 by May-end.
Note, the silver chart is simply a more obvious analog of the gold chart with a bit of added volatility. As such it serves for a good check on gold and raises doubts about copper’s breakout.
|
| |
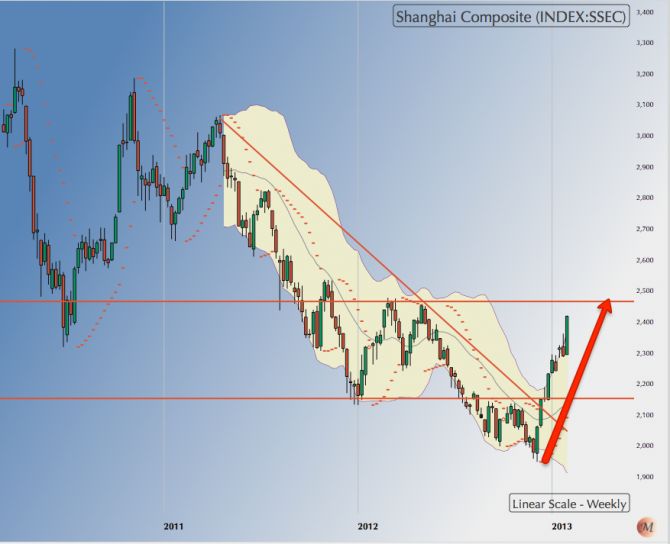 |
Shanghai Composite: the Shanghai Composite closed the week at 2419, a little short of its major overhead resistance of 2480 that it must decisively break past to signal a long-term bull run.
Amazingly, despite the phenomenal rally, the index is not really overbought on the oscillator charts.
Besides, the 50 DMA has just crossed over above the 200 DMA, signalling an intermediate rally. Looks likely that the 2480 level will be taken out in due course.
|
| |
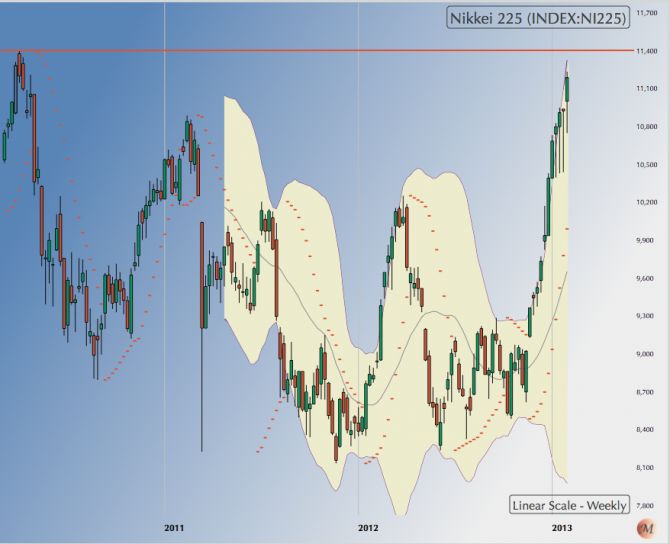 |
Nikkei 225: Nikkei closed the week at 11,190 after a few days of consolidation below 11,000.
Nikkei’s next logical target is 11,400. A decisive break above 11,400 will confirm an intermediate bull run on the Japanese market.
Exciting times ahead for major Asian markets.
|
| |
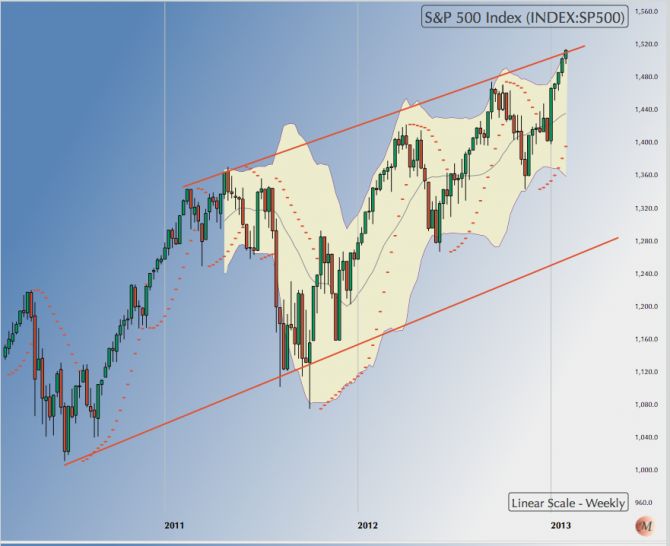 |
S&P 500: SPX closed the week at 1513.17 and had achieved its target on the charts. That doesn’t mean the rally is over.
SPX’s next major target is 1530 followed by the all-time peak of 1575 it made in 2007.
The index has both momentum and time to try for 1575. The Russel 2000 Index of mid-cap stocks, which is a better indicator of retail sentiment, closed at an all-time new high of 911 and could easily be heading for 950 by March.
That said, use sliding stops to lock in your profits. We are in the last stages of a bull market.
|
| |
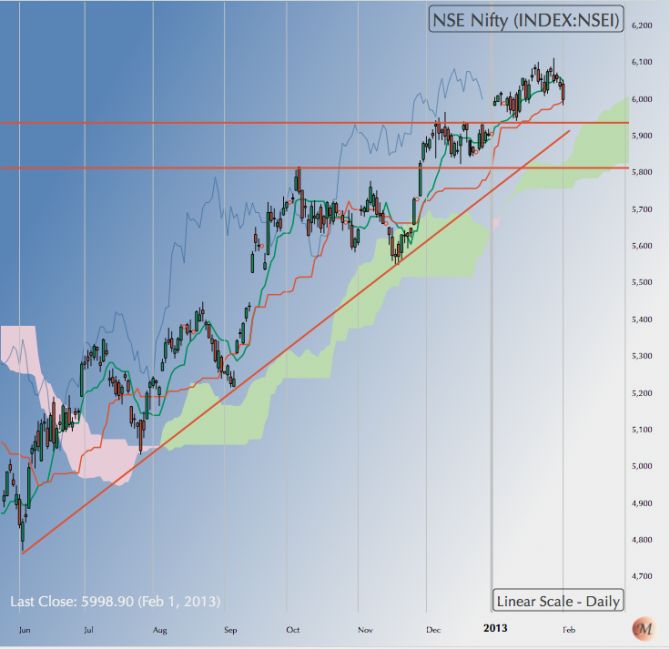 |
NIFTY: NIFTY closed the week at 5998 after making a low of 5983. Nifty has a crucial inflection point at 5950 and I have been saying that the index will retest this point as critical support before resuming its upward march or crapping out.
Expect 5950 to be tested early next week. If it holds, we will be on our way to 6185 followed by 6325.
|
NB: These notes are just personal musings on the world market trends as a sort of reminder to me on what I thought of them at a particular point in time. They are not predictions and none should rely on them for any investment decisions.
Sonali Ranade is a trader in the international markets


