Most commodities are on the verge of tipping over into deep long-term bear markets not seen for decades, says Sonali Ranade
Commodities, led by gold, clawed back some territory in a ferocious bounce but it is unlikely to be anything but a dead cat. Most commodities are on the verge of tipping over into deep long-term bear markets not seen for decades. The dead cat bounce was a second chance to sell.
The DAX provides a crucial insight into the state of the equity markets. It launched into a decent correction earlier than most indices and is on the verge of challenging its 200 DMA. The market’s reaction to a nick of its 200 DMA will provide important clues to the future of all markets.
Markets are currently in a flux, most being in a transition trapped in the middle of a counter-trend correction to a correction; sort of like the compass at the magnetic pole. But they usually emerge out of such transitions in the same direction as they entered them. I expect the DXY to retake market leadership from the yen.
Emerging markets have led in this correction and are almost half way through while the US market has yet to begin one. The usual correlations are topsy-turvy. So investors should pick their way through these markets strictly bottoms up, stock by stock. No time to be chasing the last rally up in US markets either.
Happy trading!
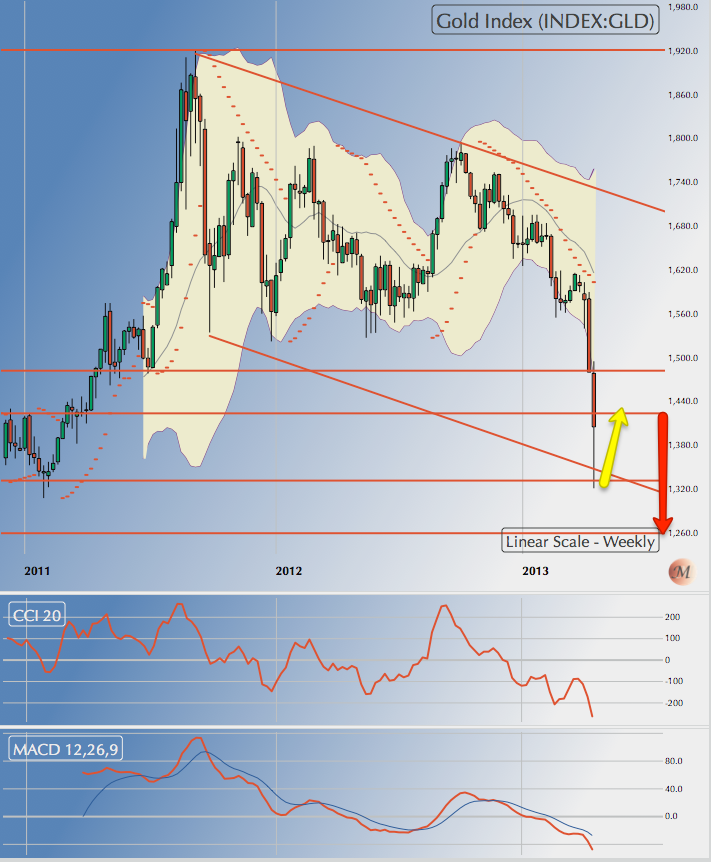 |
Gold: Gold closed the week at $1395.60 after making a new low of $1321.50 during the week. On the charts, gold is grossly oversold and has spent the last two sessions working off the oversold positions. However, in terms of time and wave counts, the price collapse in gold is far from over and may resume shortly. Gold can correct upwards to as much as $1480 as it works off oversold conditions. But it should resume its fall towards $1260 thereafter. Even $1260 may not be the final bottom for this leg of the fall and there are more legs to come in this bear market in gold. |
 |
Silver: Silver closed the week at $22.96 after making a new low $22 during the week. Silver too is grossly oversold on the charts and is working off the oversold conditions through the proverbial dead cat bounce. It could creep up to $25 in the process but don’t bet on it. Expect silver to resume its fall shortly. First support for silver is far away, just below $20. Silver’s fall has been less dramatic than that of gold but the ultimate slump in silver will be deeper and more extensive. A price of $10 before this bear market finds a bottom cannot be ruled out. The real selloff in silver is yet to come. |
 |
HG Copper: Copper closed the week at 3.11 after making a low 3.06. Copper has strong support at 3.05 but it would be wrong to assume it will hold. Copper, like other commodities, could trip into a long-term bear market below $3. Should it do so, first support lies at 2.75 followed by a more robust support at $2.25 which happens to be the metal’s long term support line from 2001 through the December 2009 low. In my opinion, the support at 3.05 could be deceptive. |
 |
WTI Crude: WTI Crude closed the week at $88.01 after making a low of $87.73 during the week. First support now lies at $84 followed by a more robust support at $77. Crude, like other commodities, could be preparing for a tip into a long-term bear market. If so, crude could well slip to $70 in this leg of the fall. First confirmation of this prognosis will come on a break of $84. So while expecting a claw back to $91.65, crude’s 200 DMA, be prepared for some dramatic falls thereafter. |
 |
US Dollar: The DXY bounced smartly from 81.80 as expected and closed the week at 82.84. The correction from the recent top of 83.66 may not be over and DXY could come back to retest 81.80 before resuming the rally towards 84.25. Maintain my bullish call on DXY. |
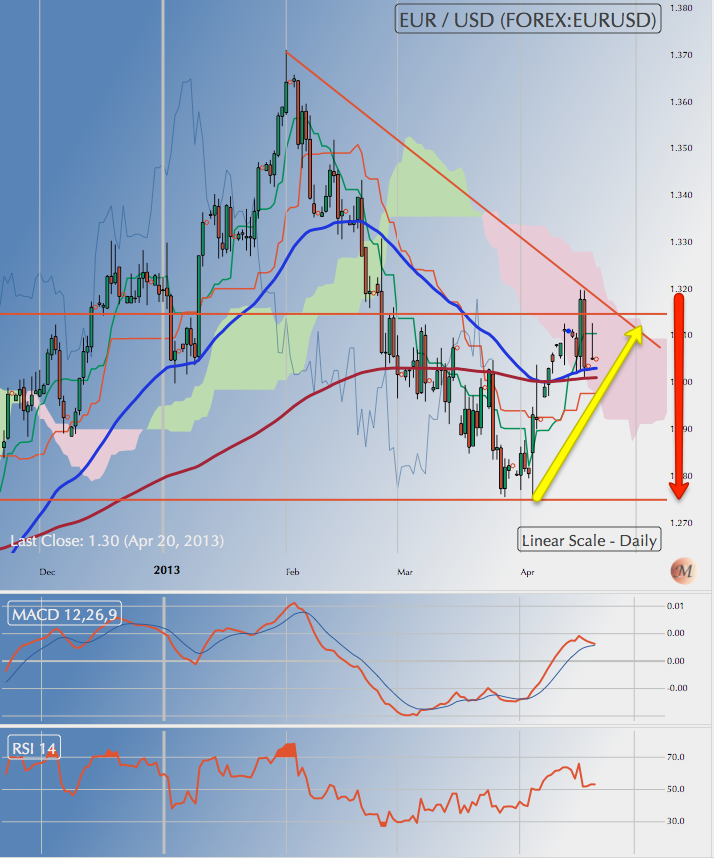 |
EURUSD: The EURUSD closed the week at 1.3051 after making a double top at 1.32. The EURUSD can drift up in a reactive move beyond 1.32 to test 1.33 during the week. Over a longer time horizon, the euro is in a correction from its recent top at 1.37 and is likely to triangulate in a congestion zone below 1.33 but above the trend line running up from 1.20 through 1.28. Expect confused movement in the currency for the next few weeks. |
 |
USDJPY: The USDJPY is headed for a retest of 100 yen. It has a strong base at 96.70. While 100 may not be taken out even this attempt and we could see a pullback to 96, the eventual target for USDJPY remains 102 and it has plenty of time to get there. |
 |
USDINR: The USDINR closed the week at 53.93 after making a low of 53.76. Logically, the dollar should now head for 55.50 over the next few weeks in line with the move up in DXY. This would happen even if the dollar is to eventually fallback to 52 in the coming months. A break of 53.50 would negate my view. |
 |
DAX: The DAX has lead the correction in the OECD equity markets and now sits right atop an important support at 7400 which happens to be its all important 200 DMA. The index closed the week at 7459.96. The DAX offers a possible preview of what is to follow in the US markets. So a brief review of the factors in play at this point. First, the DAX is in deep oversold territory and needs to work off the excesses in a corrective up move. Second, with the 200 DMA, any remaining bulls in the market can be expected to defend the point vigorously. Third, 7400 is an important support for bulls by itself given that any fall below it will wipe out all the bull gains from the rally from 7410. Last, the intermediate support line rally, running all the way from 5433 meets up with the index at 7250. So it will be interesting to see how all these factors play out to resolve the index’s direction. On sheer wave counts, my sense is that we will see a nick of the 200 DMA on a closing basis before a decent rally that may or may not make a new high above 8075. Given this, nervous bears covering shorts will add to the fun. |
 |
Russell 2000: The Russell 2000 [RUT] illustrates a conundrum similar to the one discussed for the DAX and is discussed here to show the analogous position in the US markets. [The DJIA, SPX and Nasdaq100 are periodically culled for dead wood and therefore tend to be more robust than the broader market.] The RUT has support at 894. Below that lies its 200 DMA at 855-860. And while a violation of 894 will trigger some selling it doesn’t challenge the bull markets until 860 is taken out. But if the RUT does get to 860 it will be so oversold that a pullback would be due anyway. In terms of wave counts and time RUT has the range and momentum to get to 860. The point is, much like DAX, the RUT can challenge its 200 DMA and still bounce from there into a rally that could make a higher high than 954. There is time and space for it. So bears will be covering shorts furiously at 860. Not yet time to throw in the towel for bulls. As an investor I would be sitting on substantial cash already and watching the fun from the sidelines! So the above analysis is strictly for compulsive traders. |
 |
Nasdaq100: The Nasdaq 100 looks very different from RUT and DAX but closer scrutiny reveals the same basic structure -- a not-so-oversold market heading for its 200 DMA with the long-term support line of the rally within striking distance. The index closed the week at 2780 after bouncing off its 200 DMA at 2723. So you know the game well. My sense is that the Nasdaq 100 will retest and nick the 200 DMA over the next week or two to test the rallies support line at 2700 before getting terribly oversold. And then, the by-now-familiar rip back to the top that has been the characteristic of this market will be unleashed. But I would not bet on a new high right now. |
 |
SPX: The SPX closed the week at 1555.25 just above its first support at 1530. The SPX’s oscillator charts show many divergences and are not yet into deeply oversold territory. Besides, note the gradual divergence and transition from DAX to SPX, through RUT and Nasdaq100, where DAX is the weakest and SPX the strongest. The same factors are at play though it doesn’t look like the SPX will test its 200 DMA like the other indices. Too early to call an end of the rally in US equity markets, methinks. Note, this is not about being bullish. This is merely saying we may not have seen the top yet or have a retest left. Wave counts indicate another a-b-c leg up after the current correction under way that could create a new high. |
 |
NSE NIFTY: The NSE Nifty has had a decent pullback rally from the low of 5477 and closed the week at 5688.70, overshooting my target of 5750. Having overshot, the rally can extend to as high as 5850 if it wants to without triggering off a bull move. My sense is that the correction from the top of 6110 is not yet over and we will have another test of 5450 or the support line running up from the year 2003. In fact, the current bull market’s support from 2003 will be tested multiple time before Nifty resumes a decent rally. |
Note, not all stock bottom at the same time and our markets rarely give investors a second chance in individual stocks. So stocks that fell in the first leg may not be repeated in the second leg to come. Instead, those that held out, like FMCG etc, will be dunked. So keep a ready buy list and buy blue chips at your own prices.
NB: These notes are just personal musings on the world market trends as a sort of reminder to me on what I thought of them at a particular point in time. They are not predictions and no one should rely on them for any investment decisions.
Sonali Ranade is a trader in the international markets