Some cities still haven't recovered from the 2008 economic meltdown. And others have been suffering for decades, according to Business Insider.
New data in Brookings' 2012 Global MetroMonitor shows 300 major metro areas by change in GDP per capita and employment from 1993 to 2012.
Let's have a look at 20 slowest-growing cities in the past 20 years.
Source: Business Insider
...

Sendai
Country: Japan
Real GDP per capita annualised change from 1993 to 2012: 0.0 per cent
Employment annualised change from 1993 to 2012: -0.6 per cent
Global rank: 1
...

Sapporo
Country: Japan
Real GDP per capita annualised change from 1993 to 2012: 0.1 per cent
Employment annualised change from 1993 to 2012: -0.3 per cent
Global rank: 2
...

Detroit
Country: The United States
Real GDP per capita annualised change from 1993 to 2012: 0.5 per cent
Employment annualised change from 1993 to 2012: -0.3 per cent
Global rank: 3
...

Osaka-Kobe
Country: Japan
Real GDP per capita annualised change from 1993 to 2012: 0.5 per cent
Employment annualised change from 1993 to 2012: -0.3 per cent
Global rank: 4
...

Naples
Country: Italy
Real GDP per capita annualised change from 1993 to 2012: 0.2 per cent
Employment annualised change from 1993 to 2012: -0.1 per cent
Global rank: 5
...

Niigata
Country: Japan
Real GDP per capita annualised change from 1993 to 2012: 0.7 per cent
Employment annualised change from 1993 to 2012: -0.6 per cent
Global rank: 6
...
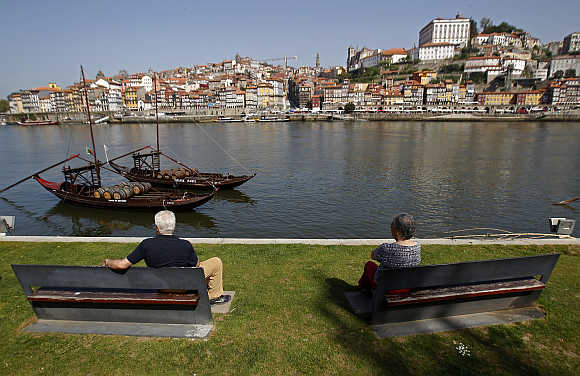
Porto
Country: Portugal
Real GDP per capita annualised change from 1993 to 2012: 0.5 per cent
Employment annualised change from 1993 to 2012: -0.2 per cent
Global rank: 7
...
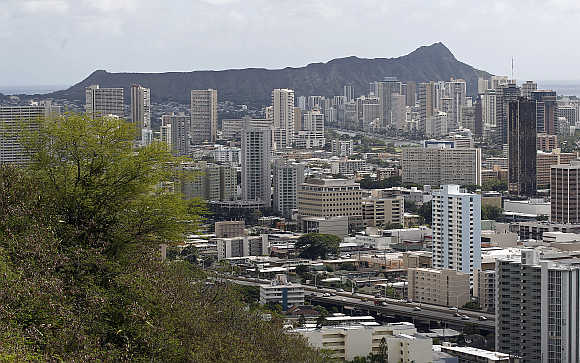
Honolulu
Country: The United States
Real GDP per capita annualised change from 1993 to 2012: 0.2 per cent
Employment annualised change from 1993 to 2012: 0.2 per cent
Global rank: 8
...

Dayton
Country: The United States
Real GDP per capita annualised change from 1993 to 2012: 0.93 per cent
Employment annualised change from 1993 to 2012: -0.4 per cent
Global rank: 9
...

Hiroshima
Country: Japan
Real GDP per capita annualised change from 1993 to 2012: 0.94 per cent
Employment annualised change from 1993 to 2012: -0.4 per cent
Global rank: 10
...

Tokyo
Country: Japan
Real GDP per capita annualised change from 1993 to 2012: 0.5 per cent
Employment annualised change from 1993 to 2012: 0.3 per cent
Global rank: 11
...

Florence
Country: Italy
Real GDP per capita annualised change from 1993 to 2012: 0.4 per cent
Employment annualised change from 1993 to 2012: 0.4 per cent
Global rank: 12
...
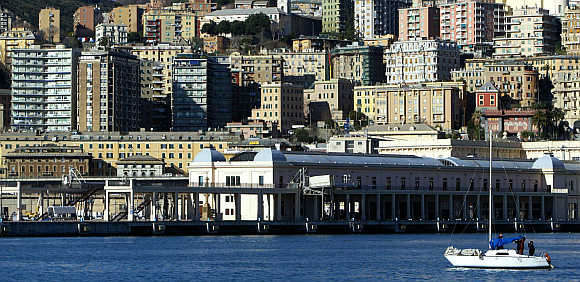
Genoa
Country: Italy
Real GDP per capita annualised change from 1993 to 2012: 0.8 per cent
Employment annualised change from 1993 to 2012: 0.4 per cent
Global rank: 13
...
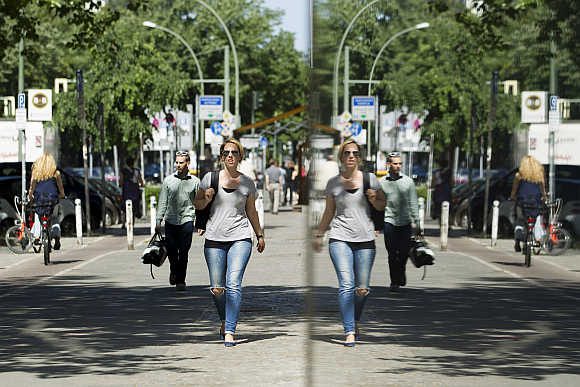
Berlin
Country: Germany
Real GDP per capita annualised change from 1993 to 2012: 0.6 per cent
Employment annualised change from 1993 to 2012: 0.5 per cent
Global rank: 14
...
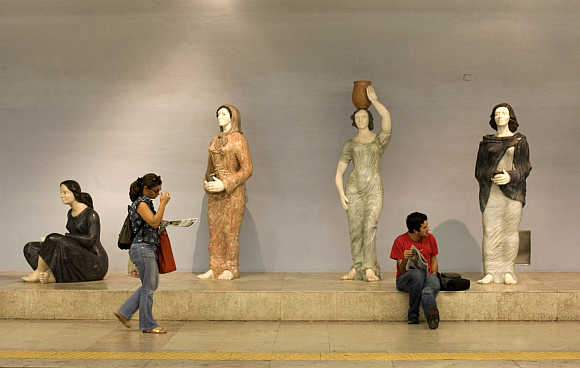
Lisbon
Country: Portugal
Real GDP per capita annualised change from 1993 to 2012: 1.0 per cent
Employment annualised change from 1993 to 2012: 0.2 per cent
Global rank: 15
...

Bologna
Country: Italy
Real GDP per capita annualised change from 1993 to 2012: 0.3 per cent
Employment annualised change from 1993 to 2012: 0.5 per cent
Global rank: 16
...

Turin
Country: Italy
Real GDP per capita annualised change from 1993 to 2012: 0.2 per cent
Employment annualised change from 1993 to 2012: 0.6 per cent
Global rank: 17
...

New Orleans
Country: The United States
Real GDP per capita annualised change from 1993 to 2012: 1.1 per cent
Employment annualised change from 1993 to 2012: -0.3 per cent
Global rank: 18
...

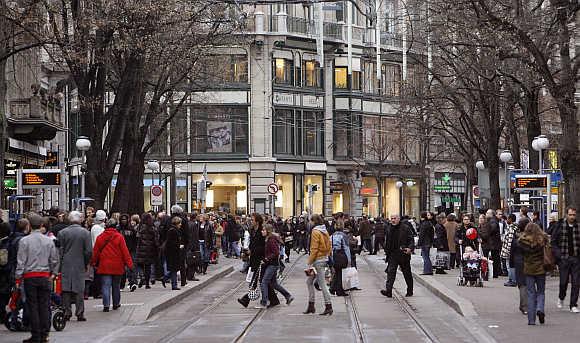
Basel-Mulhouse
Country: Switzerland
Real GDP per capita annualised change from 1993 to 2012: 0.7 per cent
Employment annualised change from 1993 to 2012: 0.4 per cent
Global rank: 19
...
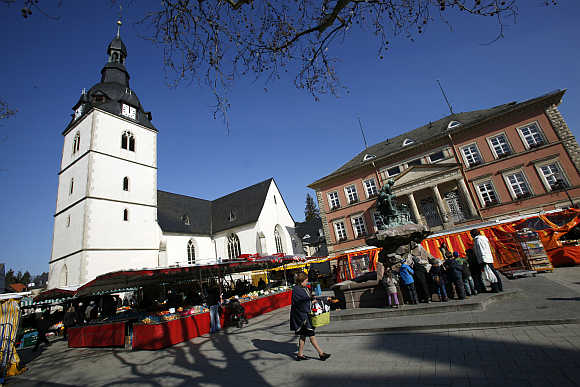
Bielefeld-Detmold
Country: Germany
Real GDP per capita annualised change from 1993 to 2012: 0.6 per cent
Employment annualised change from 1993 to 2012: 0.5 per cent
Global rank: 20