The midcap space in the US is red hot. The Russel 200 Index that represents 2000 names in the US midcap space closed the week at 905.24. Recall, the same index topped at 856 in the bull market that ended in 2007. So in fact the midcap index has already made a new high some 5.7 pc over the 2007 peak, says Sonali Ranade
The yen surprised the world with its policy driven devaluation of about 15 per cent over two months. BoJ, along with the Japanese government, has set a target of two pc for its inflation. The two measures together indicate another round of currency debasement around the world. It is highly unlikely that the Japanese intervention wasn’t coordinated with the US and EU and is aimed at China.
Be that as it may, yields on US 10-year Treasury notes remain a benign 1.83 pc. Any threat to the ongoing rally in equity markets can only come from reversal in the interest rate cycle. Even that adversity may turn into something benign if it triggers asset rotation from bonds into equities.
The midcap space in the US is red hot. The Russel 200 Index that represents 2000 names in the US midcap space closed the week at 905.24. Recall, the same index topped at 856 in the bull market that ended in 2007. So in fact the midcap index has already made a new high some 5.7 pc over the 2007 peak. That confirms the breakout of humongous proportions in the US midcap space. Will the leading indices like DJIA & S&P 500 follow suite? It is highly unlikely that they will not.
Similarly, the EU markets continue to be buoyant. The DAX closed the week at 7857 and its next target is the all time peak of 8100. The Shanghai Composite closed the week at 2291 and barring small corrections is headed towards 2480. Nikkei has turned down from 10,950 for a routine correction and has closed the week at 10,926. It is most likely to break above that resistance come Monday.
All in all, central banks have done a wonderful job in pushing up equity values.
Nearer home, NIFTY is in a firm uptrend with a logical target of 6350. Don’t forget sliding stops though.
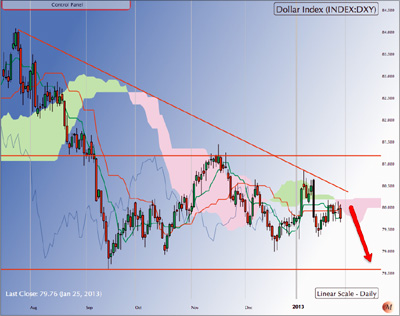 US Dollar Index [DXY]: The dollar closed the last week at 79.82, well below both its 200 and 50 DMA. US Dollar Index [DXY]: The dollar closed the last week at 79.82, well below both its 200 and 50 DMA.As noted earlier, the dollar is correcting from its recent top at 84.24, which had a target of 78.50 by March end. The move down on Friday confirmed the overall pattern for the correction. The first target for the DXY is now 79.50 followed by the final target of 78.50. Barring the usual corrective pullbacks, we can expect the dollar to drift towards 79.5 to 79 over the next week or so. Note this fall is the final leg of the correction and early terminations are not ruled out. |
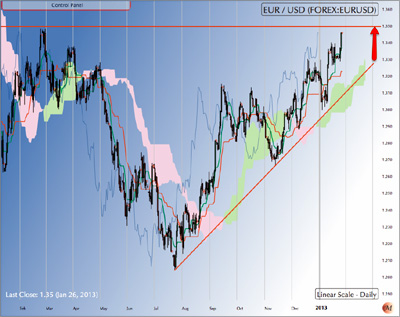 EURO-USD: The EURUSD staged a spectacular breakout above a long held trading range top of 1.34 to close the week at 1.3460. EURO-USD: The EURUSD staged a spectacular breakout above a long held trading range top of 1.34 to close the week at 1.3460. As regular readers know, I have been bullish on the euro since its bottom at 1.20 in July last year. The bullish rally had a target of 1.35 by April and we are pretty much close to the price target with time to spare. 1.35 is a formidable overhead limit that will not be surpassed easily. We can expect a test or two of the resistance but the most likely course for the euro is one of sideways consolidation between 1.34 and 1.35. Not bearish on the euro. It can surprise to the topside. |
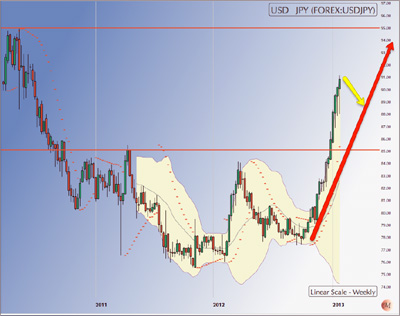 USD-JPY: The USDJPY closed the week at 90.90 knifing through the overhead resistance at 90. The dollar is in a phenomenal uptrend against the yen and since the equation is policy driven, discerning price trends from charts is fraught with risk. USD-JPY: The USDJPY closed the week at 90.90 knifing through the overhead resistance at 90. The dollar is in a phenomenal uptrend against the yen and since the equation is policy driven, discerning price trends from charts is fraught with risk.Having knifed through 90, the next major overhead resistance now stands at 95 and that could give the pair a pause. If the breakout over 90 is confirmed early next week expect the Yen to continue to 95 with minor corrections. On a failure to confirm the breakout, the dollar could fall back towards 86 before resuming a more orderly rise up. Yen is driving the general world currency debasement at this point. |
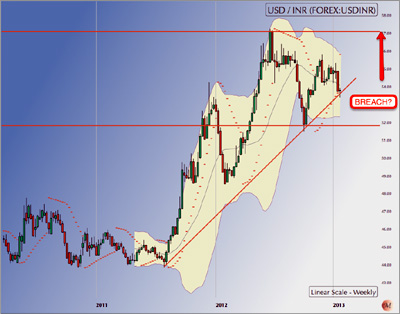 USD-INR: The dollar closed the week at 53.78 after making a low of 53.37 during the week breaching the upward sloping trend line on my charts though not on a closing basis. USD-INR: The dollar closed the week at 53.78 after making a low of 53.37 during the week breaching the upward sloping trend line on my charts though not on a closing basis.On an alternate wave count to my bullish one for the dollar, the first leg of the correction from the top of 57.3 in June 2012 is now nearing completion and the USD is due for a pull back towards 56. However, this scenario needs the USD to stay above 53.50. On a decisive breach of 53.50, the dollar could head to as low as 51.50. So it is decision time for RBI. Will the central bank succumb to the currency war and let INR appreciate or will it make some policy move? Decision time. Stay out of the market until RBI clarifies. |
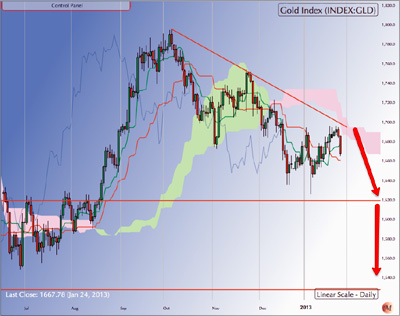 Gold: With its decisive move from the high of 1680, gold confirmed its intentions by turning down from its 50 DMA and then closing the week well below its 200 DMA. Gold closed the week at 1656.60. Gold: With its decisive move from the high of 1680, gold confirmed its intentions by turning down from its 50 DMA and then closing the week well below its 200 DMA. Gold closed the week at 1656.60.First target for gold from here is 1620. Barring some corrective pullbacks, gold should test its floor at 1620 over next week or two. The long-term trend of gold is now decisively bearish and one shouldn’t assume the last low of $1525 would hold. |
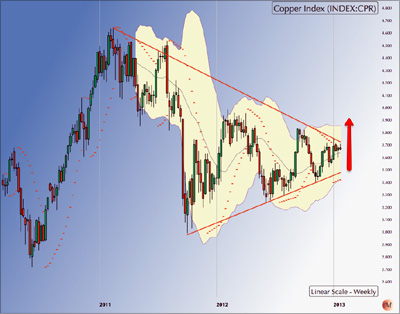 HG Copper: Copper closed the week at 3.6520. It could move down to 3.6 next week before trying to knife through the overhead resistance of 3.7 to 3.8. Copper is all coiled up for decisive action. HG Copper: Copper closed the week at 3.6520. It could move down to 3.6 next week before trying to knife through the overhead resistance of 3.7 to 3.8. Copper is all coiled up for decisive action.I am pretty bullish on copper for a target of 4.0 on a break above 3.75. Note the divergent trends in metals. Commodities are no longer moving together in a cycle. |
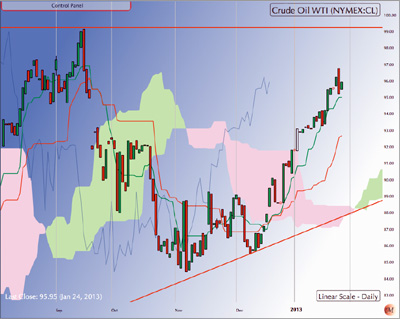 WTI Crude: Crude has been India’s Achilles’ heel for decades and it is a measure of our myopia that it is also the single biggest subsidised commodity in the domestic market. How perverse can a policy get? WTI Crude: Crude has been India’s Achilles’ heel for decades and it is a measure of our myopia that it is also the single biggest subsidised commodity in the domestic market. How perverse can a policy get?Crude closed the week at 95.88, well above the 50 and 200 DMAs. Its next major overhead resistance is 99. A break above 99 will revise the entire outlook and wave counts on crude. A breakout over 99 will be of tremendous significance for India. It would mean that the correction in crude from the top of 148 is over and crude is again long-term bullish. |
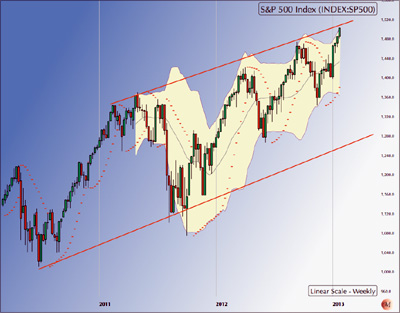 S&P 500 [SPX]: SPX has a resistance at 1520 followed by another major one at 1525 and then 1550. It closed the week at 1502.96. SPX is exhibiting all the signs of going parabolic. The oscillator charts continue bullish and don’t show extreme overbought conditions. They are also clear of divergences. In terms of wave counts and time, the rally has about a month more to go. So SPX has all the time and steam to get to previous top of 1573 if it wants to. Logically, that should be its aim for this rally. |
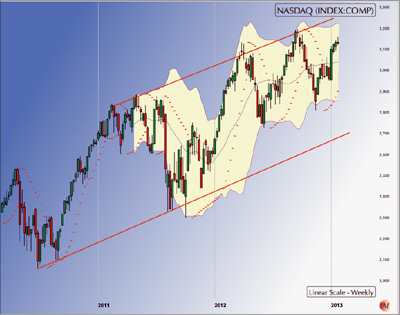 NASDAQ Composite: NASDAQ closed the week at 3149.71. NASDAQ Composite: NASDAQ closed the week at 3149.71. Recall, NASDAQ peak in 2007 was 2860 and that NASDAQ is currently well above its crash of 2007 level while SPX is not. Of the two indices, NASDAQ appears weaker but is actually better placed. Next target for NASDAQ is 3200. No overbought conditions, no divergences showing, we can expect the NASDAQ to make it there safely. In terms of time NASDAQ too is likely to peak around the time SPX does. |
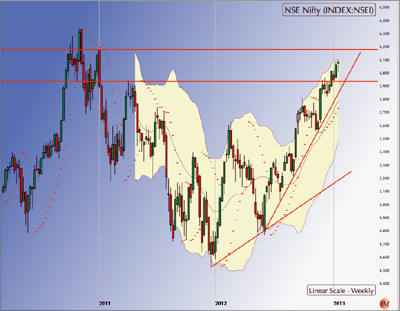 NIFTY: NIFTY closed the week at 6074.65. NIFTY: NIFTY closed the week at 6074.65.After having topped 5950, NIFTY made two attempts to come back and st 5950 but made two successive higher lows at 5992 and 6008. A close above 6100 will confirm the running correction is over as NIFTY heads on to next target of 6200. NIFTY oscillator charts are in neutral territory and the index closed to all time highs with time to spare. Maintain my view that NIFTY’s next logical target for this rally remains 6350. |
NB: These notes are just personal musings on the world market trends as a sort of reminder to me on what I thought of them at a particular point in time. They are not predictions and none should rely on them for any investment decisions.
Sonali Ranade is a trader in the international markets