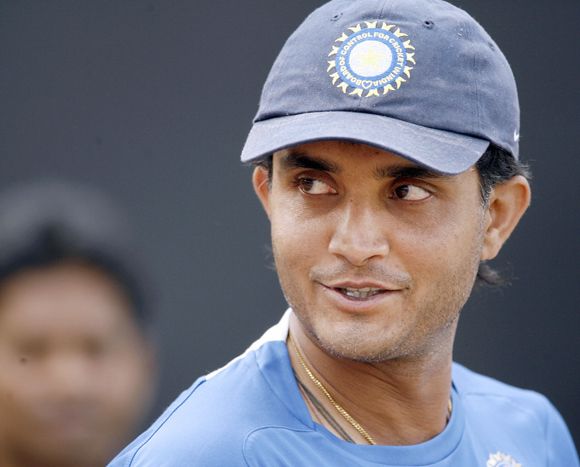
Abhirup Bhattacharaya reveals why Dada, who celebrates his 46th birthday on July 8, is one of India's most successful captains.
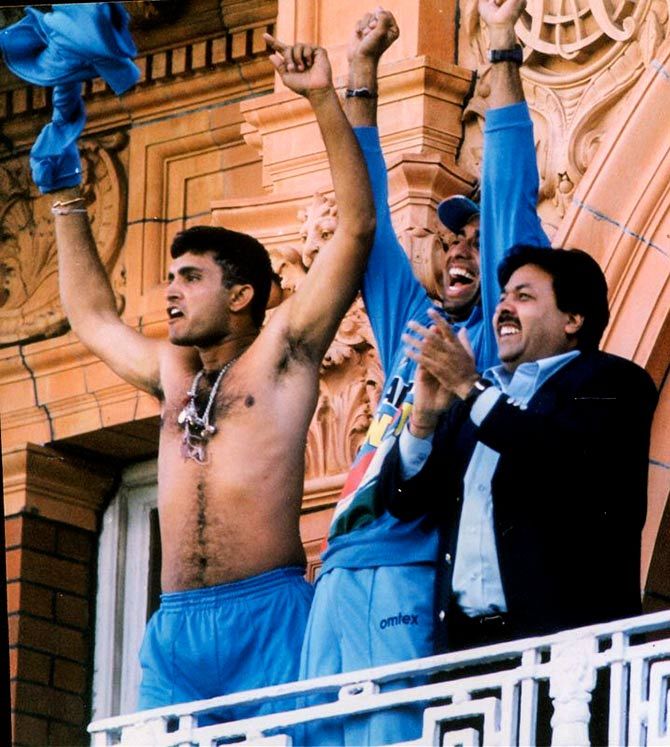
It remains one of the unforgettable images of Indian cricket. Photograph: PTI Photos
Numbers often tell a story.
It is the only way to distinguish fact from fiction.
Just like companies are driven by balance sheets and profit & loss statements, captains are rated based on their success rate.
Sourav's captaincy record speaks for itself.
If we consider Test cricket and compare his record with all Indian captains over the years, Sourav emerges as the third most successful captain in terms of win percentage and the second most successful captain in terms of win/loss ratio.
Sourav's win/loss ratio is even higher than that of M S Dhoni and still holds the record of highest number of wins overseas as a Test captain.
Virat Kohli though is expected to break the latter record in coming years.
Success rate of Indian Captains in Test cricket as on
February 10, 2018
| Player | Period | Mat | Won | Lost | Tied | Draw | W/L | %W |
|---|---|---|---|---|---|---|---|---|
| V Kohli | 2014-2018 | 35 | 21 | 5 | 0 | 9 | 4.2 | 60 |
| M S Dhoni | 2008-2014 | 60 | 27 | 18 | 0 | 15 | 1.5 | 45 |
| S C Ganguly | 2000-2005 | 49 | 21 | 13 | 0 | 15 | 1.61 | 42.85 |
| R Dravid | 2003-2007 | 25 | 8 | 6 | 0 | 11 | 1.33 | 32 |
| M Azharuddin | 1990-1999 | 47 | 14 | 14 | 0 | 19 | 1 | 29.78 |
| B S Bedi | 1976-1978 | 22 | 6 | 11 | 0 | 5 | 0.54 | 27.27 |
| A L Wadekar | 1971-1974 | 16 | 4 | 4 | 0 | 8 | 1 | 25 |
| M A K Pataudi | 1962-1975 | 40 | 9 | 19 | 0 | 12 | 0.47 | 22.5 |
| A Kumble | 2007-2008 | 14 | 3 | 5 | 0 | 6 | 0.6 | 21.42 |
| D B Vengsarkar | 1987-1989 | 10 | 2 | 5 | 0 | 3 | 0.4 | 20 |
| S M Gavaskar | 1976-1985 | 47 | 9 | 8 | 0 | 30 | 1.12 | 19.14 |
| N J Contractor | 1960-1962 | 12 | 2 | 2 | 0 | 8 | 1 | 16.66 |
| S R Tendulkar | 1996-2000 | 25 | 4 | 9 | 0 | 12 | 0.44 | 16 |
| L Amarnath | 1947-1952 | 15 | 2 | 6 | 0 | 7 | 0.33 | 13.33 |
| N Kapil Dev | 1983-1987 | 34 | 4 | 7 | 1 | 22 | 0.57 | 11.76 |
| V S Hazare | 1951-1953 | 14 | 1 | 5 | 0 | 8 | 0.2 | 7.14 |
Key: Mat=Matches, Won=Matches won, Lost=Matches lost, Tied=Matches tied, Draw=Matches drawn, W/L=Matches Won/Matches Lost, %W=Win percentage
If we consider his ODI record as captain, it is no less impressive.
Sourav comes across as the third most successful captain in terms of the number of matches won.
Success rate of Indian Captains in ODI cricket as on
February 10, 2018
| Player | Period | Mat | Won | Lost | Tied | NR | Win/Loss | % Win |
|---|---|---|---|---|---|---|---|---|
| V Kohli | 2013-2018 | 47 | 36 | 10 | 0 | 1 | 3.60 | 78.26 |
| M S Dhoni | 2007-2016 | 199 | 110 | 74 | 4 | 11 | 1.49 | 59.57 |
| R Dravid | 2000-2007 | 79 | 42 | 33 | 0 | 4 | 1.27 | 56 |
| N Kapil Dev | 1982-1987 | 74 | 39 | 33 | 0 | 2 | 1.18 | 54.16 |
| M Azharuddin | 1990-1999 | 174 | 90 | 76 | 2 | 6 | 1.18 | 54.16 |
| S C Ganguly | 1999-2005 | 146 | 76 | 65 | 0 | 5 | 1.17 | 53.9 |
| S M Gavaskar | 1980-1985 | 37 | 14 | 21 | 0 | 2 | 0.67 | 40 |
| S R Tendulkar | 1996-2000 | 73 | 23 | 43 | 1 | 6 | 0.53 | 35.07 |
Key: Mat=Matches, Won=Matches won, Lost=Matches lost, Tied=Matches tied, Draw=Matches drawn, W/L=Matches Won/Matches Lost, %W=Win percentage
In terms of contemporary Indian cricket post-2005, both M S Dhoni and Virat Kohli have been extremely successful in comparison to their predecessors in both Test and One-Day cricket.
However, while Dhoni and Kohli inherited a strong Indian team as captains, Sourav did not have any such luxury.
Some of the players who used to form the core of the Indian team were mired in the match-fixing controversy.
Sourav persisted with youngsters to fill in those slots as a result of which his winning percentage was low in the initial years.
Later, these cricketers played a significant role in ensuring the winning streak under Dhoni's captaincy.
Sourav's team was very similar to a start-up which was building a product and looking for core members; Dhoni's team was similar to such a setup receiving funding from investors; under Kohli, it is finally delivering returns for the investors.
In any organisation, while a team is being built, the management remains patient for initial years and believes in positive outcome in the later years.
The same is true in a sport like cricket.
If we compare Sourav's record with his counterparts globally, he has one of the finest records.
For the purpose of comparison, only those captains who have led the team in 100 or more ODI matches, or 40 or more Test matches have been considered.
In terms of win percentage, his record may look average, but the fact that he led a young side and still managed a win percentage exceeding 50 is commendable.
The more apt comparison will be if we look at the records of Imran Khan, Arjuna Ranatunga and Stephen Fleming along with Sourav, since each of them inherited a very young team and built it into a world-beating squad.
They were all reminiscent of time-tested CEOs.
Sourav has the highest winning percentage among these skippers, which speaks volumes of his leadership considering Test matches are the true test of their capabilities.
At the same time, it will be unfair to rate any of these skippers better than others as all of them were equally capable of leading their side under difficult situations and delivering results.
Sourav's Success Rate as compared to contemporary captains in Test cricket
| Player | Span | Mat | Won | Lost | Tied | Draw | W/L | %W | %L |
|---|---|---|---|---|---|---|---|---|---|
| S C Ganguly (IND) | 2000-2005 | 49 | 21 | 13 | 0 | 15 | 1.61 | 42.85 | 26.53 |
| S P Fleming (NZ) | 1997-2006 | 80 | 28 | 27 | 0 | 25 | 1.03 | 35 | 33.75 |
| Imran Khan (Pak) | 1982-1992 | 48 | 14 | 8 | 0 | 26 | 1.75 | 29.16 | 16.66 |
| A Ranatunga (SL) | 1989-1999 | 56 | 12 | 19 | 0 | 25 | 0.63 | 21.42 | 33.92 |
Key: Mat=Matches, Won=Matches won, Lost=Matches lost, Tied=Matches tied, Draw=Matches drawn, W/L=Matches won/Matches lost, NR=No Result, %W=Win percentage, %L=Loss percentage
The one area that Sourav lacked in, however, was his performance as a player who suffered during captaincy.
There is a stark difference in his performance as a player and a captain over the years.
From 2000 to 2005, his average varied significantly and reached a mere 24.9 in 2005 -- the same year when Sourav was dropped from the team.
Sourav's performance in Test cricket
| Year | Mat | Inns | NO | 100s | 50s | 0s | HS | Runs | Avg |
|---|---|---|---|---|---|---|---|---|---|
| 1996 | 6 | 11 | 1 | 2 | 1 | 2 | 136 | 504 | 50.4 |
| 1997 | 11 | 15 | 0 | 3 | 3 | 1 | 173 | 848 | 56.53 |
| 1998 | 5 | 9 | 1 | 0 | 1 | 0 | 65 | 267 | 33.38 |
| 1999 | 10 | 19 | 3 | 2 | 7 | 1 | 125 | 813 | 50.81 |
| 2000 | 6 | 10 | 1 | 0 | 2 | 0 | 84 | 279 | 31 |
| 2001 | 13 | 23 | 3 | 0 | 1 | 2 | 98* | 444 | 22.2 |
| 2002 | 16 | 25 | 2 | 2 | 5 | 2 | 136 | 945 | 41.09 |
| 2003 | 4 | 7 | 1 | 2 | 1 | 0 | 144 | 393 | 65.5 |
| 2004 | 8 | 9 | 0 | 0 | 4 | 0 | 88 | 408 | 45.33 |
| 2005 | 7 | 10 | 0 | 1 | 0 | 0 | 101 | 249 | 24.9 |
| 2006 | 4 | 6 | 1 | 0 | 1 | 1 | 51* | 173 | 34.6 |
| 2007 | 10 | 19 | 1 | 3 | 4 | 0 | 239 | 1106 | 61.44 |
| 2008 | 13 | 25 | 3 | 1 | 5 | 4 | 102 | 783 | 35.59 |
| 13 Years | 113 | 188 | 17 | 16 | 35 | 13 | 239 | 7212 | 42.18 |
Key: Mat=Matches, Inns=Innings, NO=Not outs, 100s=Hundreds, 50s=Fifties, HS=Highest Score, Runs=Runs scored, Avg=Average
His ODI performance over the years also looks similar to his Test record.
Sourav's performance in ODIs
| Year | Mat | Inns | NO | 100s | 50s | HS | Runs | Avg | S/R |
|---|---|---|---|---|---|---|---|---|---|
| 1992 | 1 | 1 | 0 | 0 | 0 | 3 | 3 | 3 | 23.08 |
| 1996 | 10 | 9 | 1 | 0 | 2 | 59 | 269 | 33.63 | 62.56 |
| 1997 | 38 | 35 | 3 | 1 | 10 | 113 | 1338 | 41.81 | 69.72 |
| 1998 | 36 | 35 | 3 | 4 | 7 | 124 | 1328 | 41.5 | 69.78 |
| 1999 | 41 | 41 | 3 | 4 | 10 | 183 | 1767 | 46.5 | 76 |
| 2000 | 32 | 32 | 4 | 7 | 6 | 144 | 1579 | 56.39 | 82.76 |
| 2001 | 23 | 22 | 0 | 2 | 6 | 127 | 813 | 36.95 | 71.07 |
| 2002 | 32 | 30 | 1 | 1 | 9 | 117* | 1114 | 38.41 | 82.7 |
| 2003 | 22 | 22 | 4 | 3 | 2 | 112* | 756 | 42 | 76.21 |
| 2004 | 31 | 30 | 1 | 0 | 7 | 90 | 947 | 32.66 | 69.89 |
| 2005 | 13 | 13 | 1 | 0 | 1 | 51 | 209 | 17.42 | 54.71 |
| 2007 | 32 | 30 | 2 | 0 | 12 | 98 | 1240 | 44.29 | 73.03 |
| 12 years | 311 | 300 | 23 | 22 | 72 | 183 | 11363 | 41.02 | 73.71 |
Key: Mat=Matches, Inns=Innings, NO=Not outs, 100s=Hundreds, 50s=Fifties, HS=Highest Score, Runs=Runs scored, Avg=Average, S/R=Strike Rate
Was captaincy affecting his performance?
Was Sourav unable to bear the burden of leading the side much like Sachin before him?
There are a couple of reasons for the decline in his average.
Sourav sacrificed his batting slots in both Test and ODI line-up in the interest of the team. This impacted his performance.
He was of the view that the focus should be on building a formidable team rather than on his performance.
After all, had performance been the only criteria for playing in the team, why had he been dropped in 2007, in spite of having over 1,000 runs in ODI and Test cricket?
Excerpted from Winning Like Sourav: Think And Succeed Like Ganguly by Abhirup Bhattacharaya, with the kind permission of the publishers, Rupa Publications.