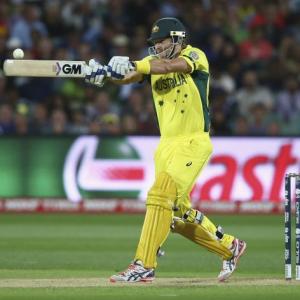
The biggest prize in the shortest format of cricket will be up for grabs when the main round of the World T20 kicks-offs in Nagpur on Tuesday.
The unpredictability of the format renders it difficult to bet on a winner.
Picking a team to win the tournament is not always a safe option, like we have seen in the past.
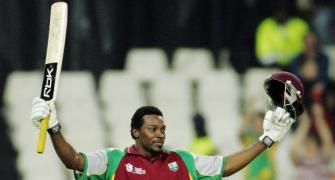
In 2012, the West Indies sprung a surprise and defeated much fancied Sri Lanka to win the title.
Two years later, the Sri Lankans beat 2007 champions India in a clinical show. After restricting India to just 130, the Lankans chased down the target with 13 balls to spare, winning by six wickets.
Pakistan and England are the other two teams to have won the World T20 title, having emerged triumphant in 2009 and 2010 respectively.
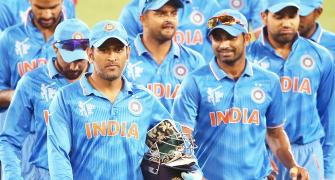
In form India start as the hot favourites in this year's tournament and will aim to become the first team to win the World T20 twice.
ODI World champions Australia would be looking to win its first World title in the T20 format.
South Africa get another opportunity to win its first-ever World title shake off the eternal 'chokers' tag.
New Zealand and England can't also be ruled out along with unpredictable Pakistan and Bangladesh, both teams will present a stiff challenge in home-like conditions.
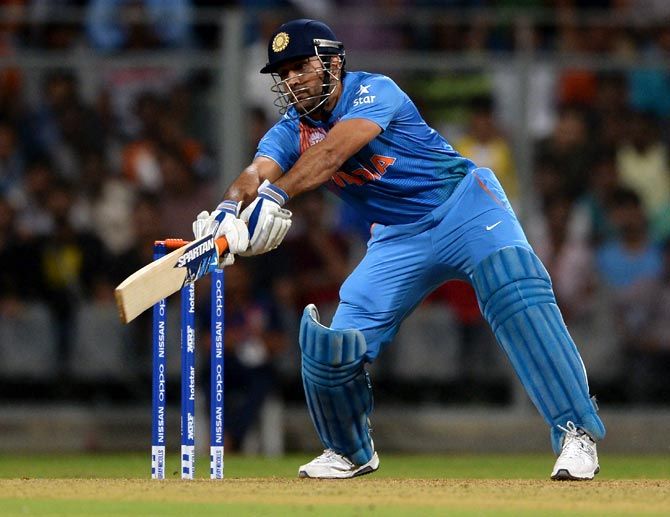
As the top 10 teams prepare to battle for the World T20 crown, Rajneesh Gupta breaks down each squad's T20 performance and their showing in previous editions of the event.
GROUP 1:
AFGHANISTAN
PERFORMANCE IN EACH WT20 CONTEST
|
2007 |
2009 |
2010 |
2012 |
2014 |
|
Did not play |
Did not play |
Round 1 |
Round 1 |
Round 1 |
PLAYING RECORD
|
|
Mts |
Won |
Lost |
NR |
%W |
|
Twenty20 Internationals |
44 |
28 |
16 |
0 |
63.63 |
|
World T20 |
10 |
4 |
6 |
0 |
40.00 |
TEAM
|
|
Matches |
Runs |
Strike Rate |
Wickets |
Economy |
Caughtt/Stumped |
|
Asghar Stanikzai (captain) |
32 |
607 |
103.76 |
1 |
6.00 |
12 |
|
Amir Hamza |
16 |
9 |
100.00 |
16 |
6.98 |
0 |
|
Dawlat Zadran |
27 |
54 |
168.75 |
34 |
7.29 |
7 |
|
Gulbadin Naib |
26 |
363 |
128.26 |
6 |
9.44 |
12 |
|
Hamid Hassan |
20 |
50 |
108.69 |
31 |
6.36 |
2 |
|
Karim Sadiq |
33 |
505 |
112.47 |
14 |
6.77 |
5 |
|
Mohammad Nabi |
41 |
586 |
134.09 |
41 |
6.95 |
21 |
|
Mohammad Shahzad (wicket-keeper) |
44 |
1,287 |
136.04 |
- |
- |
20/19 |
|
Najibullah Zadran |
23 |
398 |
141.13 |
- |
- |
11 |
|
Noor Ali Zadran |
15 |
403 |
99.26 |
- |
- |
2 |
|
Rashid Khan |
10 |
17 |
212.50 |
14 |
6.53 |
3 |
|
Samiullah Shenwari |
39 |
564 |
117.50 |
26 |
6.39 |
9 |
|
Shafiqullah |
27 |
316 |
142.34 |
- |
- |
11 |
|
Shapoor Zadran |
25 |
25 |
40.98 |
25 |
6.82 |
5 |
|
Usman Ghani |
8 |
212 |
109.84 |
- |
- |
4 |
FIXTURES
|
March 17 |
Sri Lanka |
Kolkata |
|
March 20 |
South Africa |
Mumbai |
|
March 23 |
England |
Delhi |
|
March 27 |
West Indies |
Nagpur |
ENGLAND
PERFORMANCE IN EACH EDITION OF WT20
|
2007 |
2009 |
2010 |
2012 |
2014 |
|
Round 2 |
Round 2 |
Winners |
Round 2 |
Round 2 |
PLAYING RECORD
|
|
Mts |
Won |
Lost |
NR |
%W |
|
Twenty20 Internationals |
81 |
39 |
38 |
4 |
48.15 |
|
World T20 |
26 |
11 |
14 |
1 |
42.31 |
SQUAD
|
|
Matches |
Runs |
Strike Rate |
Wickets |
Economy |
Caught/Stumped |
|
Eoin Morgan (captain) |
56 |
1,333 |
133.16 |
- |
- |
23 |
|
Moeen Ali |
12 |
130 |
116.07 |
6 |
7.56 |
2 |
|
Sam Billings |
6 |
99 |
150.00 |
- |
- |
5/1 |
|
Jos Buttler (wicket-keeper) |
42 |
648 |
135.56 |
- |
- |
11/3 |
|
Liam Dawson |
0 |
|
|
|
|
|
|
Alex Hales |
39 |
1,154 |
135.12 |
- |
- |
20 |
|
Chris Jordan |
11 |
96 |
126.31 |
12 |
8.86 |
6 |
|
Liam Plunkett |
3 |
1 |
50.00 |
7 |
7.58 |
2 |
|
Adil Rashid |
12 |
24 |
72.72 |
9 |
7.72 |
3 |
|
Joe Root |
14 |
345 |
133.72 |
4 |
10.66 |
8 |
|
Jason Roy |
8 |
104 |
111.82 |
- |
- |
1 |
|
Ben Stokes |
11 |
86 |
138.70 |
4 |
8.90 |
2 |
|
Reece Topley |
4 |
1 |
50.00 |
4 |
9.07 |
1 |
|
James Vince |
3 |
125 |
119.04 |
- |
- |
0 |
|
David Willey |
5 |
20 |
125.00 |
8 |
9.18 |
3 |
FIXTURES
|
March 16 |
West Indies |
Mumbai |
|
March 18 |
South Africa |
Mumbai |
|
March 23 |
Afghanistan |
Delhi |
|
March 26 |
Sri Lanka |
Delhi |
SOUTH AFRICA
PERFORMANCE IN EACH EDITION OF WT20
|
2007 |
2009 |
2010 |
2012 |
2014 |
|
Round 2 |
Semi-final |
Round 2 |
Round 2 |
Semi-final |
PLAYING RECORD
|
|
Matches |
Won |
Lost |
No Result |
%W |
|
World T20 |
87 |
52 |
34 |
1 |
59.77 |
|
Twenty20 Internationals |
26 |
16 |
10 |
0 |
61.54 |
TEAM
|
|
Matches |
Runs |
Strike Rate |
Wickets |
Economy |
Caught/Stumnped |
|
Faf du Plessis (captain) |
31 |
995 |
135.00 |
0 |
2.25 |
16 |
|
Kyle Abbott |
18 |
23 |
115.00 |
19 |
7.93 |
7 |
|
Hashim Amla |
33 |
888 |
128.32 |
- |
- |
15 |
|
Farhaan Behardien |
24 |
232 |
114.28 |
1 |
6.00 |
6 |
|
Quinton de Kock (wicket-keeper) |
25 |
589 |
125.05 |
- |
- |
22/7 |
|
A B de Villiers (wicket-keeper) |
67 |
1,258 |
128.89 |
- |
- |
59/7 |
|
Jean-Paul Duminy |
68 |
1,571 |
121.78 |
16 |
7.64 |
32 |
|
Imran Tahir |
23 |
17 |
154.54 |
37 |
6.72 |
3 |
|
David Miller |
42 |
741 |
133.03 |
- |
- |
26 |
|
Chris Morris |
8 |
28 |
127.27 |
11 |
8.79 |
4 |
|
Aaron Phangiso |
9 |
2 |
40.00 |
13 |
8.11 |
0 |
|
Kagiso Rabada |
13 |
5 |
83.33 |
17 |
7.66 |
2 |
|
Rilee Rossouw |
14 |
327 |
139.14 |
- |
- |
9 |
|
Dale Steyn |
40 |
15 |
75.00 |
57 |
6.52 |
11 |
|
David Wiese |
17 |
64 |
130.61 |
23 |
7.50 |
7 |
FIXTURES
|
March 18 |
England |
Mumbai |
|
March 20 |
Afghanistan |
Mumbai |
|
March 25 |
West Indies |
Nagpur |
|
March 28 |
Sri Lanka |
Delhi |
SRI LANKA
PERFORMANCE IN EACH EDITION OF WT20
|
2007 |
2009 |
2010 |
2012 |
2014 |
|
Round 2 |
Runners-up |
Semi-final |
Runners-up |
Winners |
PLAYING RECORD
|
|
Matches |
Won |
Lost |
No Result |
%W |
|
World T20 |
87 |
52 |
34 |
1 |
59.77 |
|
Twenty20 Internationals |
26 |
16 |
10 |
0 |
61.54 |
TEAM
|
|
Matches |
Runs |
Strike Rate |
Wickets |
Economy |
Caught/Stumped |
|
Angelo Mathews (captain) |
62 |
862 |
120.72 |
33 |
6.64 |
21 |
|
Dushmantha Chameera |
10 |
16 |
80.00 |
10 |
8.45 |
4 |
|
Dinesh Chandimal (wicket-keeper) |
38 |
546 |
102.82 |
- |
- |
22 |
|
Tillakaratne Dilshan |
74 |
1,751 |
120.50 |
7 |
7.43 |
31/2 |
|
Rangana Herath |
13 |
2 |
100.00 |
15 |
6.11 |
0 |
|
Shehan Jayasuriya |
9 |
156 |
113.04 |
3 |
8.65 |
2 |
|
Chamara Kapugedera |
32 |
504 |
119.71 |
- |
- |
13 |
|
Nuwan Kulasekara |
48 |
186 |
120.00 |
55 |
7.16 |
17 |
|
Suranga Lakmal |
5 |
1 |
100.00 |
5 |
8.94 |
2 |
|
Lasith Malinga |
62 |
71 |
81.60 |
78 |
7.26 |
16 |
|
Thisara Perera |
48 |
536 |
145.65 |
31 |
8.57 |
14 |
|
Sachithra Senanayake |
22 |
43 |
82.69 |
24 |
6.35 |
3 |
|
Dasun Shanaka |
8 |
76 |
89.41 |
4 |
6.83 |
0 |
|
Milinda Siriwardana |
13 |
203 |
137.16 |
6 |
8.73 |
4 |
|
Lahiru Thirimanne |
22 |
277 |
114.93 |
- |
- |
6 |
FIXTURES
|
March 17 |
Afghanistan |
Kolkata |
|
March 20 |
West Indies |
Bangalore |
|
March 26 |
England |
Delhi |
|
March 28 |
South Africa |
Delhi |
WEST INDIES
PERFORMANCE IN EACH EDITION OF WT20
|
2007 |
2009 |
2010 |
2012 |
2014 |
|
Round 1 |
Semi-final |
Round 2 |
Winners |
Semi-final |
PLAYING RECORD
|
|
Matches |
Won |
Lost |
No Result |
%W |
|
Twenty20 Internationals |
71 |
35 |
34 |
2 |
49.30 |
|
World T20 |
25 |
13 |
11 |
1 |
52.00 |
TEAM
|
|
Matches |
Runs |
Strike Rate |
Wickets |
Economy |
Caught/Stumped |
|
Darren Sammy (captain) |
60 |
526 |
152.02 |
43 |
7.21 |
28 |
|
Samuel Badree |
22 |
24 |
66.66 |
31 |
5.39 |
4 |
|
Sulieman Benn |
18 |
37 |
88.09 |
16 |
7.35 |
7 |
|
Carlos Brathwaite |
2 |
2 |
50.00 |
1 |
11.16 |
0 |
|
Dwayne Bravo |
55 |
991 |
119.54 |
40 |
8.53 |
30 |
|
Johnson Charles |
23 |
463 |
114.32 |
- |
- |
8/2 |
|
Andre Fletcher |
24 |
427 |
111.48 |
- |
- |
15/1 |
|
Chris Gayle |
45 |
1,406 |
142.59 |
15 |
7.17 |
12 |
|
Jasin Holder |
4 |
2 |
50.00 |
5 |
9.30 |
1 |
|
Evin Lewis |
0 |
|
|
|
|
|
|
Ashley Nurse |
4 |
9 |
112.50 |
0 |
7.84 |
1 |
|
Denesh Ramdin (wicket-keeper) |
52 |
385 |
123.39 |
- |
- |
30/18 |
|
Andre Russell |
35 |
219 |
124.43 |
11 |
9.57 |
8 |
|
Marlon Samuels |
40 |
952 |
122.36 |
19 |
7.75 |
8 |
|
Jerome Taylor |
19 |
53 |
106.00 |
24 |
8.13 |
5 |
FIXTURES
|
March 16 |
England |
Mumbai |
|
March 20 |
Sri Lanka |
Bangalore |
|
March 25 |
South Africa |
Nagpur |
|
March 27 |
Afghanistan |
Nagpur |
(GROUP 2)
AUSTRALIA
PERFORMANCE IN EACH EDITION OF WT20
|
2007 |
2009 |
2010 |
2012 |
2014 |
|
Semi-final |
Round 1 |
Runners-up |
Semi-final |
Round 2 |
PLAYING RECORD
|
|
Matches |
Won |
Lost |
No Result |
%W |
|
Twenty20 Internationals |
84 |
42 |
41 |
1 |
50.00 |
|
World T20 |
25 |
14 |
11 |
0 |
56.00 |
TEAM
|
|
Matches |
Runs |
Strike Rate |
Wickets |
Economy |
Caught/Stumped |
|
Steven Smith (captain) |
26 |
348 |
122.96 |
17 |
7.77 |
18 |
|
David Warner |
57 |
1,595 |
140.77 |
- |
- |
30 |
|
Ashton Agar |
1 |
- |
- |
1 |
12.50 |
1 |
|
Nathan Coulter-Nile |
13 |
50 |
121.95 |
20 |
8.16 |
6 |
|
James Faulkner |
15 |
114.81 |
19 |
8.23 |
6 |
|
|
Aaron Finch |
26 |
916 |
152.92 |
0 |
13.50 |
7 |
|
John Hastings |
7 |
43 |
130.30 |
5 |
8.33 |
1 |
|
Josh Hazlewood |
5 |
- |
- |
7 |
10.25 |
0 |
|
Usman Khawaja |
3 |
56 |
136.58 |
- |
- |
2 |
|
Mitchell Marsh |
7 |
103 |
137.33 |
3 |
8.91 |
1 |
|
Glenn Maxwell |
30 |
502 |
160.38 |
15 |
7.22 |
14 |
|
Peter Nevill (wicket-keeper) |
3 |
4 |
80.00 |
- |
- |
1 |
|
Andrew Tye |
3 |
4 |
100.00 |
2 |
10.50 |
0 |
|
Shane Watson |
54 |
1,366 |
145.01 |
43 |
7.68 |
18 |
|
Adam Zampa |
2 |
5 |
100.00 |
0 |
6.12 |
0 |
FIXTURES
|
March 18 |
New Zealand |
Dharamsala |
|
March 21 |
Bangladesh |
Bangalore |
|
March 25 |
Pakistan |
Mohali |
|
March 27 |
India |
Mohali |
BANGLADESH
PERFORMANCE IN EACH EDITION OF WT20
|
2007 |
2009 |
2010 |
2012 |
2014 |
|
Round 2 |
Round 1 |
Round 1 |
Round 1 |
Round 2 |
PLAYING RECORD
|
|
Matches |
Won |
Lost |
No Result |
%W |
|
Twenty20 Internationals |
58 |
20 |
36 |
2 |
34.48 |
|
World T20 |
21 |
5 |
15 |
1 |
23.81 |
TEAM
|
|
Matches |
Runs |
Strike Rate |
Wickets |
Economy |
Caught/Stumped |
|
Mashrafe Mortaza (captain) |
45 |
342 |
138.46 |
37 |
7.91 |
9 |
|
Shakib Al Hasan |
50 |
996 |
122.20 |
61 |
6.67 |
13 |
|
Abu Hider |
5 |
14 |
140.00 |
3 |
9.27 |
0 |
|
Al-Amin Hossain |
21 |
7 |
70.00 |
34 |
7.10 |
2 |
|
Arafat Sunny |
9 |
34 |
113.33 |
10 |
7.25 |
1 |
|
Mahmudullah |
49 |
610 |
115.31 |
20 |
6.93 |
18 |
|
Mohammad Mithun |
8 |
48 |
102.12 |
- |
- |
2 |
|
Mushfiqur Rahim (wicket-keeper) |
53 |
659 |
112.26 |
- |
- |
23/22 |
|
Mustafizur Rahman |
10 |
2 |
25.00 |
13 |
5.61 |
2 |
|
Nasir Hossain |
31 |
370 |
113.49 |
7 |
8.78 |
15 |
|
Nurul Hasan (wicket-keeper) |
6 |
54 |
125.58 |
- |
- |
0/4 |
|
Sabbir Rahman |
22 |
529 |
122.17 |
5 |
6.43 |
14 |
|
Soumya Sarkar |
15 |
271 |
117.82 |
0 |
11.00 |
9 |
|
Tamim Iqbal |
49 |
1,092 |
115.31 |
- |
- |
12 |
|
Taskin Ahmed |
12 |
17 |
94.44 |
7 |
6.05 |
1 |
FIXTURES
|
March 16 |
Pakistan |
Kolkata |
|
March 21 |
Australia |
Bangalore |
|
March 23 |
India |
Bangalore |
|
March 26 |
New Zealand |
Kolkata |
INDIA
PERFORMANCE IN EACH EDITION OF WT20
|
2007 |
2009 |
2010 |
2012 |
2014 |
|
Winners |
Round 2 |
Round 2 |
Round 2 |
Runners-up |
PLAYING RECORD
|
|
Matches |
Won |
Lost |
No Result |
%W |
|
Twenty20 Internationals |
68 |
42 |
25 |
1 |
61.76 |
|
World T20 |
28 |
18 |
9 |
1 |
64.29 |
TEAM
|
|
Matches |
Runs |
Strike Rate |
Wickets |
Economy |
Caught/Stumped |
|
M S Dhoni (captain/wicket-keeper) |
63 |
952 |
121.42 |
- |
- |
35/17 |
|
Ravichandran Ashwin |
38 |
97 |
112.79 |
46 |
6.84 |
6 |
|
Jasprit Bumrah |
11 |
0 |
- |
15 |
6.15 |
1 |
|
Shikhar Dhawan |
18 |
373 |
118.41 |
- |
- |
3 |
|
Harbhajan Singh |
28 |
108 |
124.13 |
25 |
6.20 |
7 |
|
Ravindra Jadeja |
32 |
91 |
86.66 |
25 |
7.02 |
16 |
|
Virat Kohli |
38 |
1,368 |
133.07 |
3 |
8.07 |
17 |
|
Mohammed Shami |
4 |
- |
- |
5 |
8.92 |
0 |
|
Pawan Negi |
1 |
- |
- |
1 |
5.33 |
2 |
|
Ashish Nehra |
18 |
28 |
80.00 |
26 |
8.20 |
4 |
|
Hardik Pandya |
11 |
62 |
147.61 |
10 |
7.11 |
7 |
|
Ajinkya Rahane |
17 |
324 |
113.68 |
- |
- |
14 |
|
Suresh Raina |
57 |
1,162 |
133.25 |
9 |
7.58 |
27 |
|
Rohit Sharma |
55 |
1,204 |
128.63 |
1 |
9.97 |
21 |
|
Yuvraj Singh |
51 |
1,082 |
139.43 |
27 |
7.09 |
12 |
FIXTURES
|
March 15 |
New Zealand |
Nagpur |
|
March 19 |
Pakistan |
Kolkata |
|
March 23 |
Bangladesh |
Bangalore |
|
March 27 |
Australia |
Mohali |
NEW ZEALAND
PERFORMANCE IN EACH EDITION OF WT20
|
2007 |
2009 |
2010 |
2012 |
2014 |
|
Semi-final |
Round 2 |
Round 2 |
Round 2 |
Round 2 |
PLAYING RECORD
|
|
Matches |
Won |
Lost |
No Result |
%W |
|
Twenty20 Internationals |
88 |
44 |
42 |
2 |
50.00 |
|
World T20 |
25 |
11 |
14 |
0 |
44.00 |
TEAM
|
|
Matches |
Runs |
Strike Rate |
Wickets |
Economy |
Caught/Stumped |
|
Kane Williamson (captain) |
30 |
844 |
127.68 |
3 |
10.28 |
17 |
|
Corey Anderson |
20 |
229 |
144.93 |
12 |
8.56 |
13 |
|
Trent Boult |
11 |
12 |
54.54 |
15 |
7.95 |
6 |
|
Grant Elliott |
11 |
107 |
103.88 |
11 |
8.41 |
3 |
|
Martin Guptill |
57 |
1,666 |
129.64 |
0 |
11.00 |
29 |
|
Mitchell McClenaghan |
24 |
7 |
58.33 |
26 |
7.68 |
7 |
|
Nathan McCullum |
61 |
299 |
101.01 |
55 |
6.90 |
23 |
|
Adam Milne |
14 |
19 |
90.47 |
18 |
7.35 |
4 |
|
Colin Munro |
23 |
382 |
159.16 |
0 |
10.00 |
5 |
|
Henry Nicholls |
0 |
|
|
|
|
|
|
Luke Ronchi (wicket-keeper) |
21 |
262 |
136.45 |
- |
- |
21/1 |
|
Mitchell Santner |
5 |
11 |
55.00 |
7 |
6.37 |
3 |
|
Ish Sodhi |
5 |
0 |
- |
6 |
7.41 |
2 |
|
Tim Southee |
38 |
75 |
108.69 |
46 |
8.62 |
16 |
|
Ross Taylor |
68 |
1,165 |
120.60 |
- |
- |
41 |
FIXTURES
|
March 15 |
India |
Nagpur |
|
March 18 |
Australia |
Dharamsala |
|
March 22 |
Pakistan |
Mohali |
|
March 26 |
Bangladesh |
Kolkata |
PAKISTAN
PERFORMANCE IN EACH EDITION OF WT20
|
2007 |
2009 |
2010 |
2012 |
2014 |
|
Runners-up |
Winners |
Semi-final |
Semi-final |
Round 2 |
PLAYING RECORD
|
|
Matches |
Won |
Lost |
No Result |
%W |
|
Twenty20 Internationals |
102 |
60 |
42 |
0 |
58.82 |
|
World T20 |
30 |
18 |
12 |
0 |
60.00 |
TEAM
|
|
Matches |
Runs |
Strike Rate |
Wickets |
Economy/span> |
Caught/Stumped |
|
Shahid Afridi (captain) |
94 |
1,315 |
148.92 |
93 |
6.57 |
29 |
|
Ahmed Shehzad |
40 |
941 |
115.88 |
0 |
10.00 |
13 |
|
Anwar Ali |
16 |
109 |
141.55 |
10 |
8.30 |
5 |
|
Imad Wasim |
8 |
86 |
159.25 |
7 |
6.15 |
2 |
|
Khalid Latif |
7 |
34 |
66.66 |
- |
- |
1 |
|
Mohammad Amir |
25 |
41 |
80.39 |
31 |
6.93 |
3 |
|
Mohammad Hafeez |
75 |
1,545 |
113.93 |
46 |
6.69 |
21 |
|
Mohammad Irfan |
17 |
4 |
50.00 |
13 |
6.86 |
1 |
|
Mohammad Nawaz |
2 |
- |
- |
0 |
10.66 |
1 |
|
Mohammad Sami |
10 |
17 |
60.71 |
17 |
8.16 |
2 |
|
Sarfraz Ahmed (wicket-keeper) |
17 |
270 |
120.00 |
- |
- |
8/2 |
|
Sharjeel Khan |
7 |
154 |
137.50 |
- |
- |
3 |
|
Shoaib Malik |
74 |
1,372 |
110.73 |
25 |
6.89 |
28 |
|
Umar Akmal |
75 |
1,611 |
122.97 |
- |
- |
45/2 |
|
Wahab Riaz |
17 |
101 |
107.44 |
17 |
8.31 |
4 |
FIXTURES
|
March 16 |
Bangladesh |
Kolkata |
|
March 19 |
India |
Kolkata |
|
March 22 |
New Zealand |
Mohali |
|
March 25 |
Australia |
Mohali |

