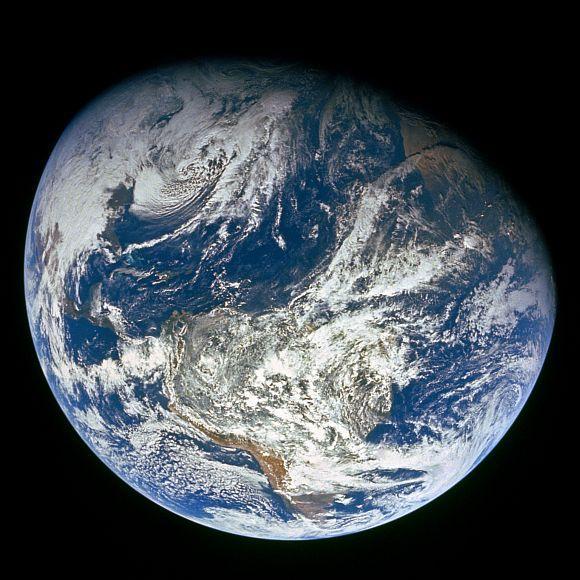
Our earth is constantly changing.
Some changes are a natural part of the climate system, such as the seasonal expansion and contraction of the Arctic sea ice pack. The responsibility for other changes, such as the Antarctic ozone hole, falls squarely on humanity's shoulders.
American space agency National Aeronautics and Space Administration's World of Change series documents how our planet's land, oceans, atmosphere, and Sun are changing over time.
Let's take a look how our world has changed.
Click on NEXT to go further...
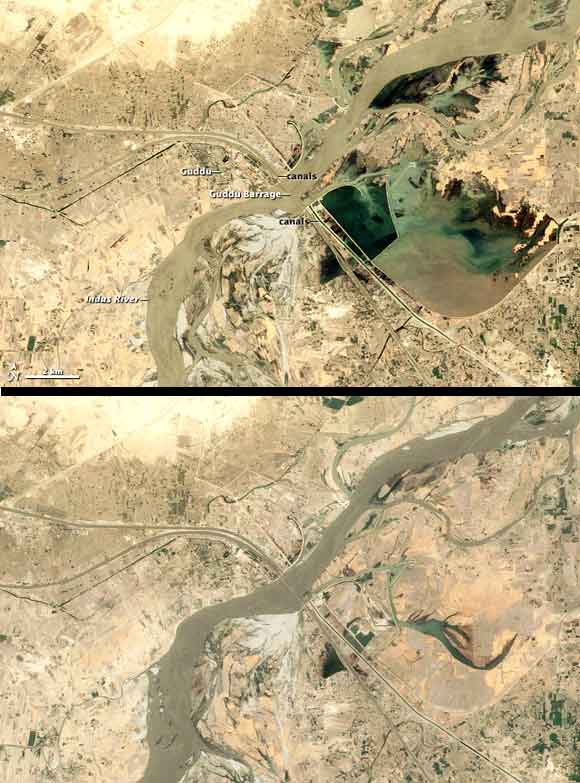
Fed by glaciers in the Himalayas and Karakoram mountains -- and by monsoon rains -- the Indus river experiences substantial fluctuations every year. Because the river irrigates 18 million hectares of farmland, the landscape changes along with the river.
Although river levels rise in June, the Indus generally remains confined to its channels. Rainfall intensifies in July, and Pakistan actually receives about 70 per cent of its annual rainfall between July and September. In July and August, some water may overflow into holding structures and depressions along the Indus, while large quantities are distributed to farmers who flood their fields, particularly for rice.
Water flow along the river begins to decline around early September, but the surrounding fields turn lush green as Kharif crops mature. Indus water levels continue dropping, and fields slowly brown through January and February. The irrigation infrastructure that stores water throughout the year becomes especially useful in the winter months, as farmers irrigate Rabi crops. Fields green again in late February.
By June 2010 the region looks parched. In fact, water levels on the Indus and in the holding structure east of the barrage are lower in June 2010 -- shortly before the historic 2010 monsoon floods -- than in June 2009.
Click on NEXT to go further...
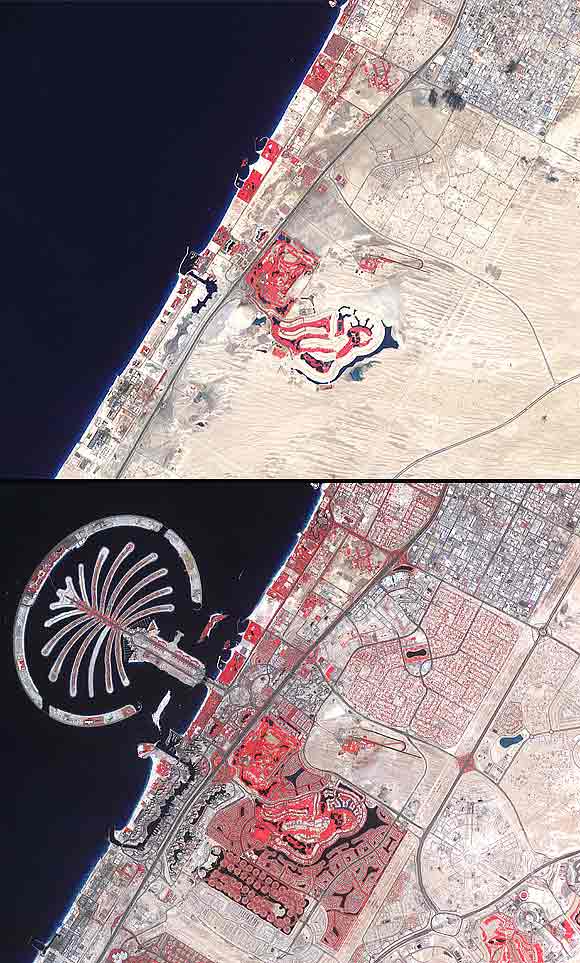
To expand the possibilities for beachfront tourist development, Dubai, part of the United Arab Emirates, undertook a massive engineering project to create hundreds of artificial islands along its Persian Gulf coastline. Built from sand dredged from the sea floor and protected from erosion by rock breakwaters, the islands were shaped into recognisable forms, including two large palm trees
In these false-colour images, bare ground appears brown, vegetation appears red, water appears dark blue, and buildings and paved surfaces appear light blue or gray. The first image, acquired in November of 2000, shows the area prior to the island's construction boom.
The final image, acquired in February 2011, shows vegetation on most of the palm fronds, and numerous buildings on the tree trunk. As the years pass, urbanisation spreads, and the final image shows the area almost entirely filled by roads, buildings, and irrigated land.
Click on NEXT to go further...
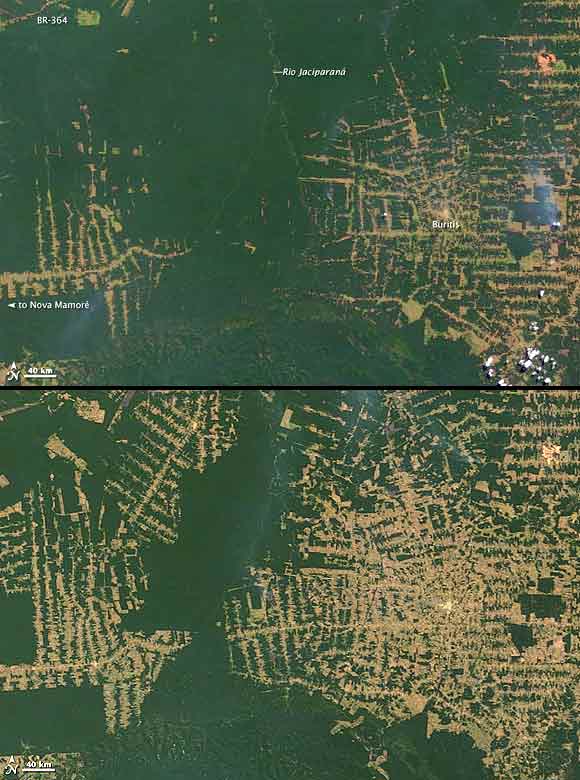
The state of Rondonia in western Brazil -- once home to 208,000 square kilometers of forest (about 51.4 million acres), an area slightly smaller than the state of Kansas -- has become one of the most deforested parts of the Amazon.
In the past three decades, clearing and degradation of the state's forests have been rapid: 4,200 square kilometers cleared by 1978; 30,000 by 1988; and 53,300 by 1998. By 2003, an estimated 67,764 square kilometres of rainforest had been cleared.
All major tropical forests, including those in the Americas, Africa, Southeast Asia, and Indonesia, are disappearing, mostly to make way for human food production, including livestock and crops.
Although tropical deforestation meets some human needs, it also has profound, sometimes devastating, consequences, including social conflict and human rights abuses, extinction of plants and animals, and climate change -- challenges that affect the whole world.
Click on NEXT to go further...
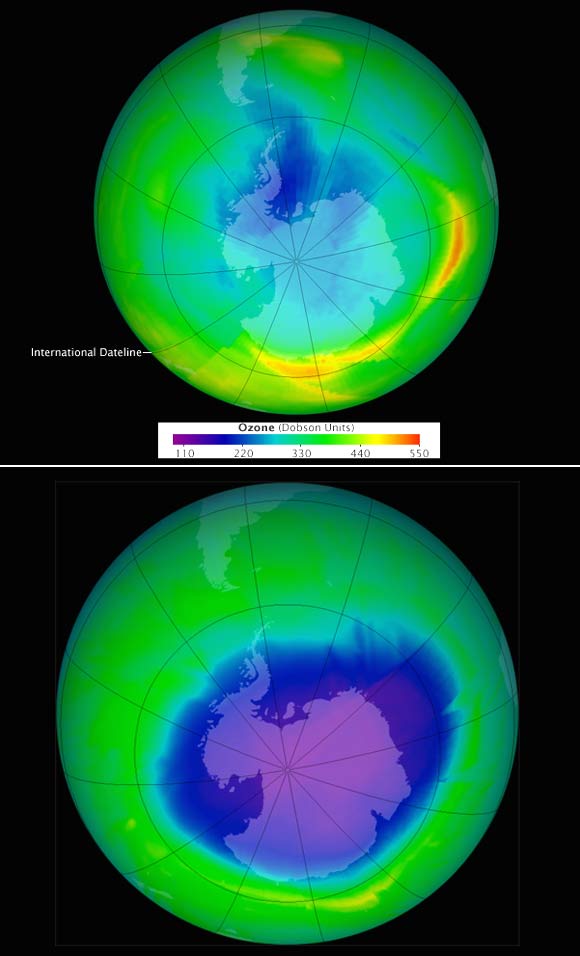
The stratospheric ozone layer protects life on Earth by absorbing ultraviolet light, which damages DNA in plants and animals (including humans) and leads to skin cancer. In the early 1980s, through a combination of ground-based and satellite measurements, scientists began to realise that the earth's natural sunscreen was thinning dramatically over the South Pole each spring. This large, thin spot in the ozone layer came to be known as the ozone hole.
As the images show, the word 'hole' is not literal; no place is empty of ozone. Scientists use the word as a metaphor for the area in which ozone concentrations drop below the historical threshold of 220 Dobson Units. Using this metaphor, they can describe the hole's size and depth.
Scientists estimate that about 80 per cent of the chlorine (and bromine, which has a similar ozone-depleting effect) in the stratosphere over Antarctica today is from human, not natural, sources.
Models suggest that the concentration of chlorine and other ozone-depleting substances in the stratosphere will not return to pre-1980 levels until the middle decades of this century. These same models predict that the Antarctic ozone layer will recover around 2040.
On the other hand, because of the impact of greenhouse gas warming, the ozone layer over the tropics and mid-southern latitudes may not recover for more than a century, and perhaps not ever.
Click on NEXT to go further...
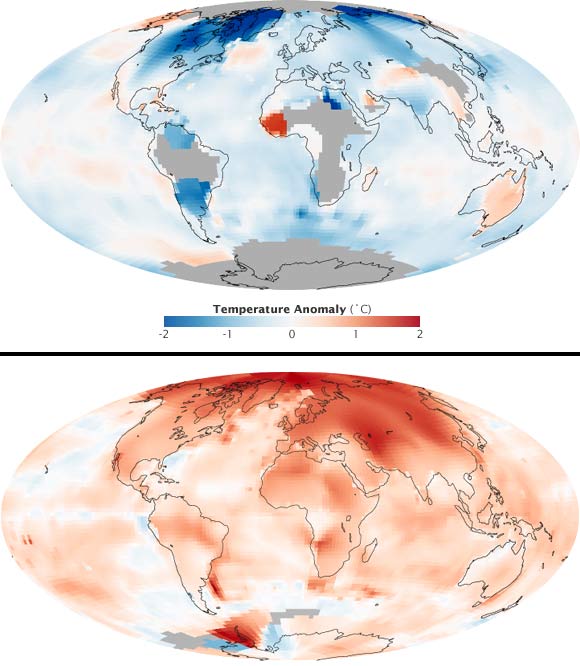
The world is getting warmer. Whether the cause is human activity or natural variability -- and the preponderance of evidence says it is likely humans -- thermometer readings all around the world have risen steadily since the beginning of the industrial revolution.
The temperatures we experience locally and in short periods can fluctuate significantly due to predictable cyclical events (night and day, summer and winter) and hard-to-predict wind and precipitation patterns.
But the global temperature mainly depends on how much energy the planet receives from the sun and how much it radiates back into space -- quantities that change very little. The amount of energy radiated by the earth depends significantly on the chemical composition of the atmosphere, particularly the amount of heat-trapping greenhouse gases.
The average global temperature on earth has increased by about 0.8 degree Celsius since 1880. Two-thirds of the warming has occurred since 1975, at a rate of roughly 0.15-0.20 degree Celsius per decade.
A one-degree global change is significant because it takes a vast amount of heat to warm all the oceans, atmosphere, and land by that much. In the past, a one- to two-degree drop was all it took to plunge the earth into the Little Ice Age. A five-degree drop was enough to bury a large part of North America under a towering mass of ice 20,000 years ago.
Global warming does not mean temperatures rose everywhere at every time by one degree. Temperatures in a given year or decade might rise 5 degrees in one region and drop 2 degrees in another. Exceptionally cold winters in one region might be followed by exceptionally warm summers. Or a cold winter in one area might be balanced by an extremely warm winter in another part of the globe.
Click on NEXT to go further...

The sun is in a state of unusually high activity since about the last 60 years.
The temporal variation in the solar activity displays a similarity to that of the mean temperature of the earth.
These scientific results therefore bring the influence of the sun on the terrestrial climate, and in particular its contribution to the global warming of the 20th century, into the forefront of current interest.
However, researchers have shown that the sun can be responsible for, at most, only a small part of the warming over the last 20-30 years.
With increased solar activity (and stronger magnetic fields), the cosmic ray intensity decreases, and with it the amount of cloud coverage, resulting in a rise of temperatures on the earth. Conversely, a reduction in solar activity produces lower temperatures.
Click on NEXT to go further....
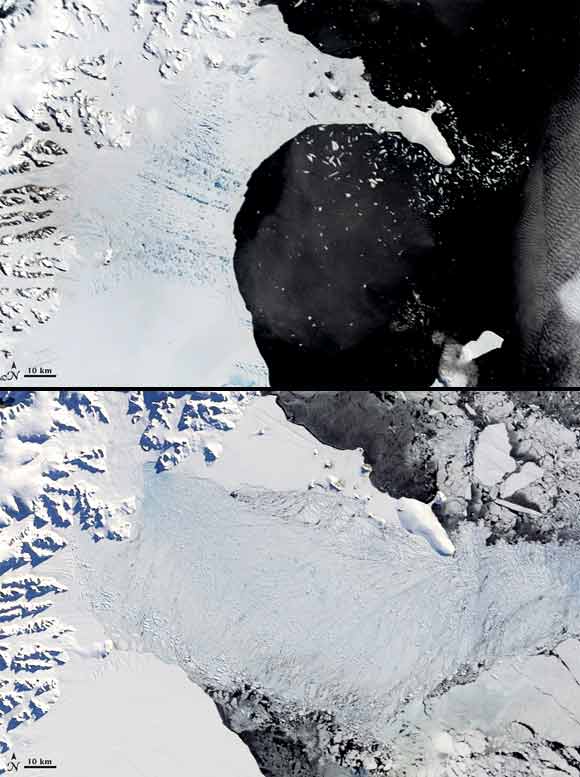
In the Southern Hemisphere's summer of 2002, scientists monitoring daily satellite images of the Antarctic Peninsula watched in amazement as almost the entire Larsen B Ice Shelf splintered and collapsed in just over one month. They had never witnessed such a large area -- 3,250 square kilometres -- disintegrate so rapidly.
The collapse of the Larsen B Ice Shelf was captured from the Moderate Resolution Imaging Spectroradiometer on NASA's Terra satellite between January 31 and April 13, 2002.
At the start of the series, the ice shelf (left) is tattooed with parallel lines of blue dots. The dots are pools of meltwater, and they are arranged in lines because the water drained into existing crevasses. Beneath a thin layer of clouds, a smattering of icebergs appears in the dark, open waters of the bay (right).
By February 17, the leading edge of the C-shaped shelf had retreated about 10 kilometers (6 miles) as the shelf began to splinter. The next good view of the area came on February 23; several more long and narrow icebergs had fractured from the shelf in the south. By March 7, the shelf had disintegrated into a blue-tinged mixture of slush and icebergs. Many of the bergs were too tall and narrow to float upright. They toppled over and spread out across the bay like a neat row of books that had been knocked off a shelf.
The collapse of the Larsen appears to have been due to a series of warm summers on the Antarctic Peninsula, which culminated with an exceptionally warm summer in 2002. Significant surface melting due to warm air temperatures created melt ponds that acted like wedges; they deepened the crevasses and eventually caused the shelf to splinter.
Other factors might have contributed to the unusually rapid and near-total disintegration of the shelf. Warm ocean temperatures in the Weddell Sea that occurred during the same period might have caused thinning and melting on the underside of the ice shelf. As the surface melt ponds began to fracture the shelf, strong winds or waves might have flexed the shelf, helping to trigger a runaway break up.
Click on NEXT to go further...
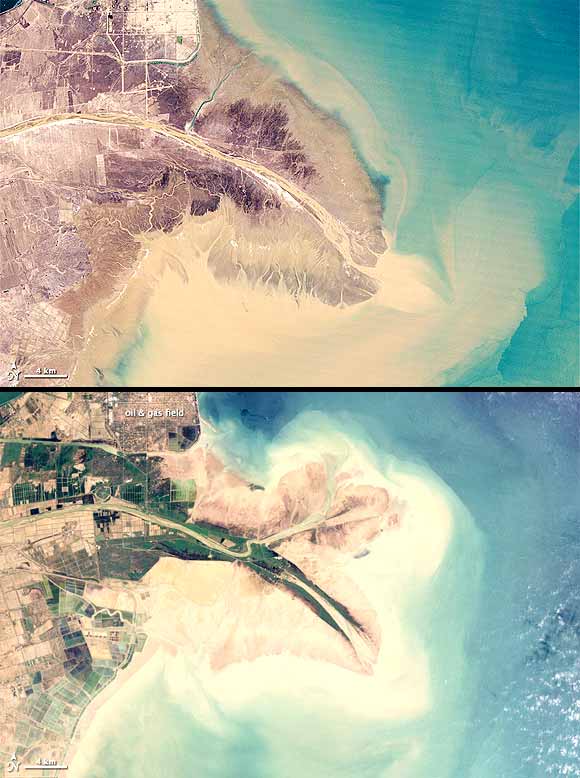
China's Huang He (Yellow River) is the most sediment-filled river on Earth. Flowing northeast to the Bo Hai Sea from the Bayan Har Mountains, the Yellow River crosses a plateau blanketed with up to 300 meters (980 feet) of fine, wind-blown soil. The soil is easily eroded, and millions of tons of it are carried away by the river every year. Some of it reaches the river's mouth, where it builds and rebuilds the delta.
Between 1989 and 1995, the delta became longer and narrower along a southeast-bending arc. In 1996, however, Chinese engineers blocked the main channel and forced the river to veer northeast.
By 1999, erosion and settling along the old channel caused the tip of the delta to retreat, while a new peninsula had formed to the north. The new peninsula thickened in the next five-year interval, and what appears to be aquaculture (dark-coloured rectangles) expanded significantly in areas south of the river as of 2004.
By 2009, the shoreline northwest of the new river mouth had filled in considerably. This may be the outcome that the engineers were anxious to achieve: the land northwest of the newly fortified shoreline is home to an extensive field of oil and gas wells. Their protection is a primary concern.
Although levees, jetties, and seawalls allow officials to slow erosion and direct the flow of the river, other challenges to protecting the delta's natural wetlands and its agricultural and industrial development remain.
Click on NEXT to go further...
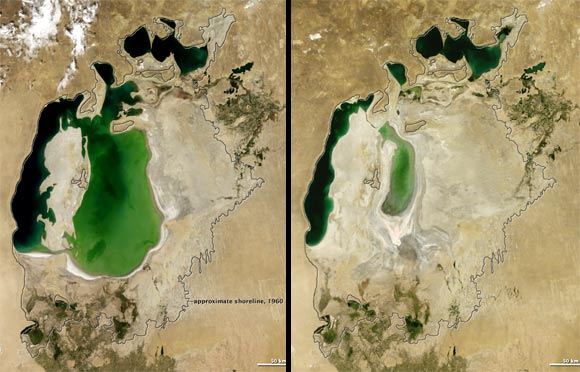
In the 1960s, the Soviet Union undertook a major water diversion project on the arid plains of Kazakhstan, Uzbekistan, and Turkmenistan.
The region's two major rivers, fed from snowmelt and precipitation in faraway mountains, were used to transform the desert into fields for cotton and other crops. Before the project, the two rivers left the mountains, cut northwest through the Kyzylkum Desert -- the Syr Darya to the north and the Amu Darya to the south -- and finally pooled together in the lowest part of the desert basin. The lake they made, the Aral Sea, was once the fourth largest lake in the world.
Although irrigation made the desert bloom, it devastated the Aral Sea. These images document the changes throughout the past decade.
By 2001, the southern connection had been severed, and the shallower eastern part retreated rapidly over the next several years. Especially large retreats in the eastern lobe of the Southern Sea appear to have occurred between 2005 and 2009, when drought limited and then cut off the flow of the Amu Darya. Water levels increased in 2010 after the drought broke and then began to dwindle again in 2011.
As the lake dried up, fisheries and the communities that depended on them collapsed. The increasingly salty water became polluted with fertilizer and pesticides. The blowing dust from the exposed lakebed, contaminated with agricultural chemicals, became a public health hazard.
The salty dust blew off the lakebed and settled onto fields, degrading the soil. Croplands had to be flushed with larger and larger volumes of river water. The loss of the moderating influence of such a large body of water made winters colder and summers hotter and drier.
In a last-ditch effort to save some of the lake, Kazakhstan built a dam between the northern and southern parts of the Aral Sea. Completed in 2005, the dam was basically a death sentence for the southern Aral Sea, which was judged to be beyond saving. All of the water flowing into the desert basin from the Syr Darya now stays in the Northern Aral Sea.
Click on MORE to see another PHOTO feature...