
Although the Indian economy remained in the red throughout the year, there were some countries that did much better than India while there were some that did not.
Let's take a look at some of the best and worst economies of 2013.
Source: CNN Money
...

Brunei
Measure of success: Government debt
Least government debt: 2.4 per cent
Brunei, which has a per capita income of $50,440, had just 2.4 per cent government debt in 2013.
...

Equatorial Guinea
Measure of success: Total investments
Total investments: 61.3 per cent of GDP
Equatorial Guinea, which has a per capita income of $25,929, attracted total investments worth 61.3 per cent of GDP in 2013.
...

South Sudan
Measure of success: Fastest growing
Fastest growing: 24.7 per cent GDP growth
South Sudan, which has a per capita income of $1,006, saw 24.7 per cent GDP growth in 2013.
...

United States
Measure of success: Largest economy
Largest economy: $16.7 trillion GDP
United States, which has a per capita income of $52,839, saw its GDP grow to $16.7 trillion in 2013.
...

Luxembourg
Measure of success: Highest per capita income
Highest per capita income: $110,573
Luxembourg, which has a population of more than 500,000, reported the highest per capita income at $110,573 in 2013.
Click NEXT to see some of the worst economies...
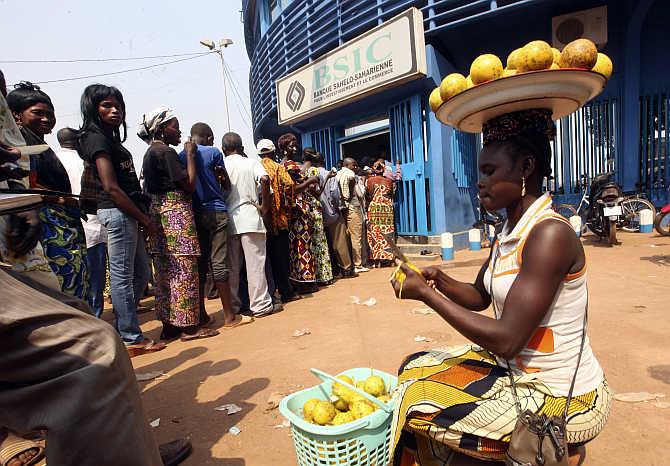
Central African Republic
Measure of failure: Change in GDP
Change in GDP: Minus 14.5 per cent
Central African Republic, which has a per capita income of $800, saw its economy shrink by minus 14.5 per cent in 2013.
...

Malawi
Measure of failure: GDP per capita
GDP per capita: $215.22
Malawi, whose population is 16,407,000, had a GDP per capita of $215.22 in 2013.
...

Iran
Measure of failure: Inflation
Inflation: 42.3 per cent
Iran, which has a per capita income of $12,986, saw its inflation jump to 42.3 per cent in 2013.
...

Macedonia
Measure of failure: Unemployment rate
Unemployment rate: 30.02 per cent
Macedonia, which has a per capita income of $10,718, reported more than 30 per cent unemployment rate in 2013.
...

Japan
Measure of failure: Government debt
Government debt: 244 per cent
Japan, which has a per capita income of $37,135, saw its government debt jump to 244 per cent in 2013.