
With 28 league games completed, we are exactly two-thirds into the World Cup qualifying stages. We take a look here at how the nine Test-playing nations are shaping up, primarily on their tournament form displayed so far (see also notes below).
Terms: Economy or run rate = Runs per over
Average = Runs per dismissal
Strike rate (batting) = Runs per 100 balls
Strike rate (bowling) = Balls per wicket
Australia
Strengths
Batting: Preserving wickets (average of 52.1 runs per dismissal and 182.0 runs per dismissal during Powerplays); High run rate overall (5.6 runs per over)
Bowling: 4.2 runs per over and 16.7 balls per wicket in Powerplays; Fast bowling: 3.9 runs per over and 22.8 balls per wicket; Highest number of catches per innings: 5
Weaknesses
Batting: 5.2 runs per over scored during Powerplays
Bowling: 32.4 balls per wicket; Spin bowling: 85.7 balls per wicket.
Notes:
*All stats taken before Saturday's match between India and South Africa
* Batting performance has been classified into openers, middle order (numbers 3, 4 and 5) and lower middle order (6, 7, 8) and performance during the powerplays have also been taken into account.
* Bowling performance has been classified into how the fast bowlers, spinners and backup bowlers have performed, again taking Powerplays into account.
* The analysis is based on a relative comparison of the batting, bowling and fielding performance by the teams as compared to other Test-playing nations.

Bangladesh
Strengths
Batting: First (mandatory) Powerplay: 5.8 runs per over
Bowling: Only 6% of runs conceded as extras
Weaknesses
Batting: Average opening partnership (43.0 runs per dismissal); poor run rate overall (4.6); Powerplay while batting: Poor runs per dismissal (21.9); Poor run rate (5.4)
Bowling: Powerplay while bowling: Poor average (42.9 runs per wicket); poor economy (5.3); Most number of run outs so far (5); Poor strike rate (37.7 balls per wicket); Poor economy (5.3); Fast bowling: Poor economy (5.6) and strike rate (40.9); Spin bowling: Poor economy (5.0).

England
Strengths
Openers: Good strike rate (97.6); Only 1 run out conceded so far
Weaknesses
Lower middle order: Poor average (10.8); Losing too many wickets during the batting (third) Powerplay (13.2 runs per dismissal) with poor run rate (6.40)
Bowling: Poor economy (5.5); poor strike rate (36.0); Powerplay while bowling: Poor economy (5.7); Fast bowling: Poor economy (5.5) and strike rate (37.3); Backup bowlers: Poor economy (5.1); average (184.0) and strike rate (216.0); Extras: Highly profligate (98 runs) with the highest extras (33) in any innings twice.

India
Strengths
Batting: High run rate (6.1); high average runs per dismissal (46.2); High openers' strike rate (112.0); High Powerplay run rate (6.2)
Bowling: Strike rate: Fast bowlers (22.3); backup bowlers (42.8); Fielding: Catches (16) and run outs (4)
Weaknesses
Bowling: Poor economy (5.2) and average (27.5); Poor Powerplay economy rate (5.5); Spin bowling: Poor economy (5.0); average (55.5) and strike rate (67.0); High number of run outs conceded (4).
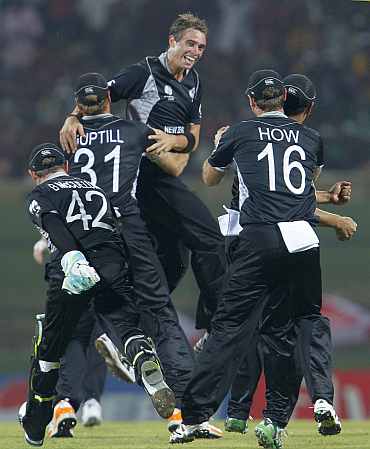
New Zealand
Strengths
Batting: Openers: High average runs per dismissal (79.0); high partnership average (66.5); No run outs conceded so far
Bowling: Very good average (19.1) and strike rate (26.5) powered by fast bowling and backup bowlers; Best spin bowling economy (2.3)
Weaknesses
Batting: Middle order: Poor average (33.6)
Bowling: Poor spin bowling strike rate (90.0); High percentage of extras conceded (9.4%).

Pakistan
Strengths
Batting: Lower middle order: High average (28.0) and strike rate (94.2)
Bowling: Spin bowling: Good economy (4.1) and average (16.7)
Weaknesses
Batting: Poor average (28.5) and run rate (5.3); Openers: Poor average score each (11.6), strike rate (62.4) and partnership average (15 runs); Middle order: Poor strike rate (74.6); Powerplay while batting: Poor average runs per dismissal (27.3)
Bowling: Powerplay while bowling: Poor average runs per wicket taken (28.4); Backup bowlers: Poor economy (5.1) and strike rate (57.0); High extras as a percentage of runs scored (11%); Low number of catches per innings (2.3).

South Africa
Strengths
Batting: Middle order: Good average (60.7) and strike rate (93.1)
Bowling: Overall bowling: Good economy (4.0) and strike rate (25.6), especially during Powerplays; Fast bowling: Very economical (3.7); Spin bowling: Good strike rate (19.2); High number of catches (4.7) per innings
Weaknesses
Batting: Openers: Poor opening stand average (43.0) and strike rate (73.8); Poor run rate while batting (5.3), especially during Powerplays (5.2)
Bowling: Poor fast bowler strike rate (36.4).

Sri Lanka
Strengths
Batting: Good run rate (6.0) and average (46.8) from openers, middle order and lower middle order; Powerplay while batting: Good run rate (6.4), predominantly due to mandatory Powerplay
Bowling: Spin bowling: Good economy (3.8), average (13.6) and strike rate (21.3); Backup bowling: High average (19.1) and strike rate (27.8)
Weaknesses
Bowling: Economy rate of fast bowlers (4.8).

West Indies
Strengths
Batting: High middle order strike rate (101.4); Powerplay while batting: Good run rate (5.7)
Bowling: Good average of runs per wicket (19.0) and strike rate (26.0), led by Powerplay bowling; Fast bowlers: Good economy (4.1) and average (15.6); Spinners: Good strike rate (23.4); Least extras conceded as a percentage of runs scored (3.7%)
Weaknesses
Batting: Poor average (30.6), due to lower middle order (9.7)
Bowling: Backup bowling: Poor strike rate (137.2) and average (102.0).