
Photographs: Lucas Jackson/Reuters
Mass use on Internet started growing 20 years ago, and withing two decades there are now about two billion people connected to the online world.
Let's take a look at the growth of Internet and how it will evolve in the future.
Source: Business Insider
...
A look at how the online world is changing
Photographs: Vivek Prakash/Reuters
Internet story
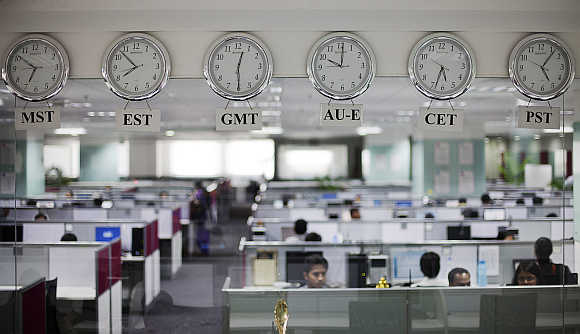
How old is commercial Internet? 20 years old
How many have access to Internet? Two billion
What's the total global population? About seven billion
...
A look at how the online world is changing
Photographs: Vivek Prakash/Reuters
Internet access (G 20 countries, including India)
Fixed connection (2005): 230 million
Fixed connection (2010): 300 million
Mobile connection (2010): 700 million
Fixed connection (2015): 520 million
Mobile connection (2015): 2,700 million
...
A look at how the online world is changing
Photographs: Stefano Rellandini/Reuters
Global Internet device sales
Tablets: 930,000,000
Smartphones: 850,000,000
Personal computers: 360,000,000
...
A look at how the online world is changing
Photographs: Tony Gentile/Reuters
Projected global Internet device sales
Tablets (2016): 2,700,000,000
Smartphones (2016): 2,300,000,000
Personal computers (2016): 300,000,000
...
A look at how the online world is changing
Photographs: Eduardo Munoz/Reuters
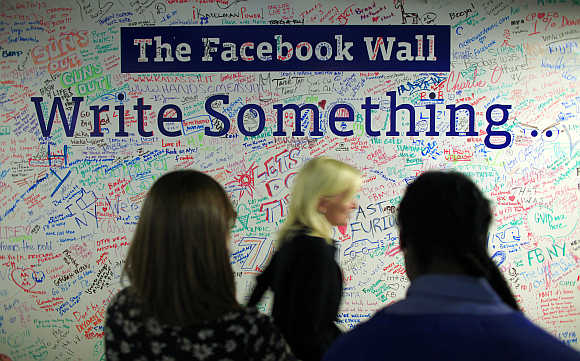
Monthly active Facebook users: 1 billion
Monthly active Facebook users: 550 million
...
A look at how the online world is changing
Photographs: Noah Berger/Reuters
Social networks (monthly unique visitors)
Facebook: 160,000
Twitter: 40,000
Linkedin: 38,000
Tumblr: 21,0000
Google+: 20,000
Pinterest: 15,000
...
A look at how the online world is changing
Photographs: Mike Segar/Reuters
Social networks
Average time spent on social networks: 26 minutes per day
Average time spent on portals: 18 minutes per day
...
A look at how the online world is changing
Photographs: Lucas Jackson/Reuters
Market value
Market value of Apple: $623 billion
Market value of Google: $250 billion
Market value of Amazon: $150 billion
Market value of Facebook: $50 billion
...
A look at how the online world is changing
Photographs: Stephen Lam/Reuters
Old media vs new media
Market value of old media: $450 billion
Market value of new media: $1,500 billion
...
A look at how the online world is changing
Photographs: Marcus Donner/Reuters
US digital advertising
Google: 55 per cent
Facebook: 11 per cent
Microsoft: 8 per cent
Yahoo: 7 per cent
AOL: 4 per cent
Other: 15 per cent
...
A look at how the online world is changing

Photographs: Erik de Castro/Reuters
Advertising
Offline advertising share (US): 62 per cent
Online advertising share (US): 38 per cent
...
A look at how the online world is changing

Photographs: Kim Kyung Hoon/Reuters
Advertising share
TV advertising share (US): 42 per cent
Online advertising share (US): 38 per cent
Print advertising share (US): 9 per cent
Radio advertising share (US): 7 per cent
Outdoor advertising share (US): 4 per cent
...
A look at how the online world is changing

Photographs: Fred Prouser/Reuters
Digital video revenue
Hulu: $4,500 million
YouTube: $4,000 million
Netflix: $3,000 million
...
A look at how the online world is changing
Photographs: Lucy Nicholson/Reuters
Online advertising
Google: 62 per cent
All other online: 27 per cent
Facebook: 11 per cent
article