Rain rules, okay!
Dr Srinivas Bhogle
Editor's note: On May 23, in London, an International Cricket Conference
committee chaired by India's Sunil Gavaskar will examine and, where
necessary, recalibrate, the playing conditions that govern the game.
The enhanced use of technology in umpiring will be taken up. So, too, will
the mandatory use of lights to make up for lost time in Test cricket.
Also up for review is the Duckworth Lewis system governing the recalibration
of runs and required run rates in rain-interrupted matches. That the D/L
system has its advantages is universally accepted; that it occasionally
throws up ridiculous situations is equally obvious.
When the D/L system was questioned in the past, the argument in favour
always was: TINA.
There Is No Alternative.
Well, now there is. An Indian, Jayadevan by name, has devised, with
painstaking attention to detail, an alternative system. Various Indian
umpires have looked at, and been impressed by it. Various former players of
repute -- including Gavaskar himself -- have received the document.
So... we present it for you. In detail, with analysis and insight. Read it,
compare it with the existing system, then let us know what you think. Who
knows, this could be the cricketing law of the future...
Jayadevan's rain rules for LOI cricket
In January 2001, I received an e-mail from Frank Duckworth and Tony
Lewis who have jointly developed the Duckworth/Lewis (D/L) method for
resetting targets in limited-over international (LOI; earlier called ODI) cricket matches. "We hear that someone called
Jayadevan from India is proposing an alternative to the D/L method", they
wrote, "do you know more about this method?".
I didn't. But being Harsha Bhogle's brother has its advantages. I
could, in a day or two, establish e-mail contact with V Jayadevan, who
turned out to be a civil engineer from Thrissur in Kerala with a Master's
degree in building technology from IIT, Madras.
Jayadevan (J) sent me a lot of material about his proposed method. Even a cursory glance at J's papers was enough to convince me that his method was truly promising. So we started corresponding on e-mail and even met one weekend in Bangalore. I also had the opportunity to discuss Jayadevan's proposed method with Duckworth and Lewis, and play the role of the moderator as J and D/L exchanged reactions.
In this article, I will attempt a detailed introduction of Jayadevan's method. [J has recently significantly revised his method, to correct certain technical anomalies, many of them pointed out by D/L. He has also made a technical presentation to the BCCI on April 7, 2001. I understand that the BCCI has advised Jayadevan to communicate his method to the ICC]. In a subsequent article we will try to determine if Jayadevan's method could replace the D/L method.
Introducing the Jayadevan method
Like the D/L method, the Jayadevan method also recognises that a fair target must
take into account information about overs remaining and wickets
lost. But while Duckworth and Lewis responded to this requirement by building a sophisticated, and elegant, mathematical model, Jayadevan appears to be using a practical engineer's approach.
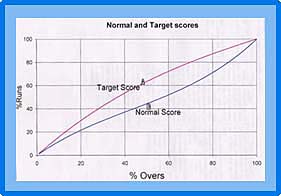
Jayadevan method is essentially built around two curves. The first curve depicts
the "normal" run getting pattern; i.e., when there is no interruption and the side is expecting to bat its full quota of overs.
The second curve ("target curve") indicates how the batting side should "speed up" after an interruption.
The "normal" curve takes into account both the percentage of overs played and the percentage of wickets lost. The "target" curve, which is used to set revised targets, only considers the percentage of overs played.
How does Jayadevan fabricate these two curves? The explanation is a trifle technical, but I would urge readers to try to read on, especially because Jayadevan has been quite clever. But those of you who have no interest at all in such arguments can safely jump to the next section.
To obtain the normal score curve Jayadevan looks at samples of LOI match results, choosing in particular some close finishes. Instead of actual runs scored or wickets lost; he considers the corresponding percentage values.
Jayadevan then considers the percentage of runs scored in seven
phases: settling down (first 10% of the overs, i.e. the five overs),
exploiting field restrictions (next 20% of the overs, i.e. overs 6-15),
stabilising the innings-I (next 20%; overs 16-25), stabilising the innings-II (next 10%; overs 26-30), beginning the acceleration (next 20%; overs
31-40), secondary stage of acceleration (next 10%; overs 41-45) and final
slog (last 10%; overs 46-50).
The normal score curve is then obtained by fitting a suitable regression equation for the cumulative overs % and the corresponding cumulative runs scored %.
How does Jayadevan obtain the target score curve? He looks at the percentage of runs scored in each of the seven scoring phases, arranges them in descending order of run productivity, and again obtains a regression fit for cumulative overs % versus the juxtaposed cumulative runs scored %. This clever ploy is reminiscent of the rationale behind the Australian "most productive overs" concept, which was a good idea with a flawed execution.
The Jayadevan look-up table
Like D/L, the Jayadevan method also reads off values, to
determine the victory target, from a table. The table has twelve columns: for overs %,
"target runs" % and "normal runs" % corresponding to 0,1,2 ..9 wickets fallen (for
uniformity, Jayadevan calls these 0%, 10%, 20% .. 90% wickets fallen). For overs played before an interruption, we read off values from the normal runs% columns. After an interruption, we use values from the target runs% column. An extract from Jayadevan's full table appears below:
To get a feel for how Jayadevan calculates, here are two or three
simple situations involving interruptions while Team 2 is batting:
Example 1: Team 1 score 280 runs in 50 overs. During the break, there is a
shower and Team 2 can only bat for 40 overs. What is Team 2's target?
Following the interruption, Team 2 must bat for 40 overs out of 50, i.e. for 40/50 =80% of
the overs. Looking up the J table, we note that the "target run" % corresponding to 80% overs is 87.6%. So Team
2 must score 280 x 87.6% = 246 runs to win.
[The corresponding D/L target is 253]
Example 2: Team 1 score 280 runs in 50 overs. Team 2 are 75/2 in 20 overs when
there is an interruption which takes away 10 overs. What is Team 2's
winning target in the 20+20=40 overs?
Team 2 have two batting spells. In the first spell of 20 out of 50 possible overs (20/50 = 40% overs) Team 2 bat "normally". Looking at the table we note that the expected normal run % for 40% overs, and the loss of two wickets, is 36.5%. So, in this spell, Team 2 should have reached a score of 280 x 36.5% = 102.20. After the interruption, Team 2 can bat for only 20 out of the remaining 30 overs; so their winning target must be reduced. To reset the target, look up the target run% corresponding to 20/30 = 66.7% overs. The tabulated value is 77.7% (read off from the full J table). To stay on course, Team 2 must score 77.7% of the remaining (280-102.20) runs, i.e. (280-102.20) x 77.7% = 138.15 in their 20 overs. Team 2's winning target in 20+20 overs is therefore 102.20 + 138.15 = 241 runs.
[The corresponding D/L target is 246]
Example 3: Team 1 score 280 runs in 50 overs. Team 2 are 75/2 in 20 overs when
there is an interruption which takes away 20 overs. What is Team 2's
winning target in the 20+10=30 overs?
Once again, Team 2 must bat in two spells. In the first spell of 20 overs (40% overs) of "normal" batting, they must, as in Example 2, reach 102.20 to stay on par (they have only scored 75/2, so they might already be in trouble!). In the spell after the interruption Team 2 can bat for only 10 out of the 30 remaining overs. The target run% corresponding to 10/30 = 33.3% overs is 46.2 (read off from Jayadevan's full table). To stay on course, Team 2 must score (280-102.20) x 46.2% = 82.15 runs in these 10 overs. Team 2's winning target in 20+10 overs is therefore 102.20 + 82.15 = 185 runs (because of their slow start, Team 2 appear unlikely to win; they must now score 110 more runs in 10 overs to win).
[The corresponding D/L target is 181]
Our explanation of the Jayadevan method will be built around examples. To cover the entire gamut of LOI situations, and verify how the J method performs, we will look at all the five possible interruption situations: (a) interruption between Team 1 and Team 2's innings, (b) single interruption while Team 2 are batting, (c) single interruption while Team 1 are batting, (d) more than one interruption while Team 2 are batting and (e) more than one interruption while Team 1 are batting. In each case, we will also indicate the corresponding D/L target.
Interruption between Team 1 and Team 2's innings
The Example 1, discussed above, highlights this interruption situation. Here's another example:
Example 4: Team 1 score 250 in 50 overs. A stoppage between innings leaves Team 2 to bat only for 30 overs.
J's target runs% corresponding to 60% overs is 72.3%. The J target is therefore 250 x 72.3% = 181. [The corresponding D/L target is 193]
Single interruption while Team 2 are batting
This is perhaps the interruption situation which occurs most often. Examples 2 and 3, discussed earlier, are instances of such a situation. Here are three more examples, including the famous instance of the 1992 World Cup semi-final between England and South Africa.
Example 5: Team 1 score 250 in 50 overs. In reply, Team 2 are 90/0 in 20 overs when there is an interruption lasting 20 overs. Team 2 return to bat the last 10 overs.
Team 2 bat in two spells. During the "normal" batting spell of 20 out of 50 (20/50 = 40%) overs, Team 2 should have scored 32.4% of the required runs (see the J table). This works out to 250 x 32.4% = 81 runs (so Team 2 are doing well, being 9 runs ahead of their "par score" of 81). In the post-interruption spell, Team 2 can bat for only 10 out of the 30 remaining overs (10/30 = 33.3%). The target run% corresponding to 33.3% overs is 46.2. Team 2's "par score" in the second spell is therefore (250-81) x 46.2% = 78.1 runs. Team 2's winning target (they win if they are just ahead of the par score) is therefore 81 + 78.1 = 160. [The corresponding D/L target is 143]
Example 6: In reply to Team 1's 250 in 50 overs, Team 2 are 191/9 in 30 overs when the game has to be called off.
Team 2 bat "normally" till the interruption. The normal run% corresponding to 30/50 = 60% overs and 90% wickets lost, is 95% (see the J table extract). Team 2's "par score" in this situation should therefore have been 250 x 95% = 237.5, i.e. they should have scored 238 runs at this stage to win. Since Team 2 have only reached 191, they lose.
[The D/L target is 232].
Example 7: In the 1992 World Cup semi-final, England make 252 in the stipulated 45 overs. South Africa are 231/6 in 42,5 overs, when 2 overs are lost. How much should South Africa score off the last ball to win?
This celebrated example has become some sort of a benchmark to evaluate every target revision method. Note that South Africa have batted "normally" for 42.83/45 = 95% of the overs. The normal run% in 95% overs, for the fall of six wickets, is 91.6%. So the par score at this stage was 252 x 91.6% = 230.83. In the post-interruption spell, Team 2 can bat for only 1 ball (0.17 overs) out of 13 remaining balls (2.17 overs), i.e. for 0.17/2.17 = 7.8% overs. The target run% corresponding to 7.8% overs is about 12% (read off from the full J table). The par score for the second spell is therefore (252-230.83) x 12% = 2.54. South Africa's winning target is therefore 230.83 + 2.54 = 234 runs. So by the J method South Africa needed 3 to win off the last ball. [D/L's target is also 3 runs off the last ball].
The table below summarises some more (hypothetical and real) examples of single interruptions while Team 2 are batting:
Single interruption while Team 1 are batting
The many examples that we have considered suggest that, in most cases, the D/L and J estimates are very close to each other.
The alert reader must, however, have noticed that we did not work out any example where Team 1's innings was interrupted. When Team 1's innings is unexpectedly curtailed or terminated, they are usually disadvantaged with respect to Team 2 (in the D/L terminology, Team 1 have "fewer resources" compared to Team 2). This disadvantage must be compensated and that can happen in one of two ways: increase Team 2's winning target, or decrease the number of overs that Team 2 can face.
There are several reasons why we must choose the first option; chiefly because the second option could decrease the number of overs that Team 2 can face to below 25, in which case there's no match! While cricket fans initially found it hard to accept targets revised upwards, mindsets now appear to be changing after the use of the D/L method for over three years. What probably bothers cricket fans more now is whether these revised targets are fair and realistic.
The Jayadevan method also provides the option to revise Team 2's target upwards. Unlike the G50 criterion proposed by D/L, Jayadevan is able to use his normal run and target run percentages to directly "scale up" targets. We shall now look at some typical examples involving an upward revision of Team 2's target.
Example 8: Team 1 are comfortably placed at 200/2 in 40 overs when their innings is suddenly interrupted. What should be Team 2's target in 40 overs?
It is clear that the interruption affects Team 1 more because they were expecting to bat 50 overs. Playing at their "normal" pace, Team 1 would, after accounting for the two wickets lost, have scored 70.9% of their total runs in 40/50 = 80% overs according to the J table. If Team 1 knew from the start that it was a 40-over match, they would have been expected to score 87.6% of their total runs (target run% in 80% overs). Team 2's winning target should therefore be "scaled up" to be 200 x (87.6/70.9)% = 248 runs.
[The corresponding D/L target is 252, and its calculation involves the use of the G50 factor].
Example 9: Team 1 are 125/4 in 25 overs when there is a heavy downpour. If only 25 more overs can be bowled, what should be Team 2's target in 25 overs?
Having played 50% of their overs, Team 1's normal run% for the loss of 4 wickets is 51.9% (see the J table extract). Team 2's target run% in 50% overs is 63.4. Team 2's winning target is therefore 125 x (63.4/51.9)% = 153.
[The corresponding D/L target is 170].
Example 10: Team 1 are in deep trouble at 125/8 in 25 overs when there is a heavy downpour. If only 25 more overs can be bowled, what should be Team 2's target in 25 overs?
Having played 50% of their overs, Team 1's normal run% for the loss of 8 wickets is 87%. Team 2's target run% in 50% overs is 63.4. If we imitate the calculation in Example 9, we obtain Team 2's winning target as 125 x (63.4/87.0)% = 91.09 or 92 runs.
For various reasons, Jayadevan argues that a target lower than 125 for Team 2 is not acceptable. He therefore stipulates that whenever the "scale up" factor is below 1, it should be set equal to 1. Team 2's target is therefore simply 125 x 1 plus 1, i.e. 126.
[The corresponding D/L target is 103].
Example 11: Team 1 are 180/4 after 42 overs when the match is interrupted. Only 35 more overs can be bowled. So Team 1's innings is terminated and Team 2 must bat 35 overs. What would be Team 2's winning target?
Team 1's normal score% in 84% overs and with the fall of 4 wickets is 76.0% (from the full J table). The target run% for 84% overs is 90.3. So the J target in 42 overs is 180 x (90.3/76.0)% = 213.9. Since Team 2 can play only 35 out of these 42 overs (i.e. 83% of the overs), we must consider the target run% for 83% overs which is 89.6. So Team 2's target in 35 overs is 213.9 x 89.6% = 192 runs.
[The corresponding D/L target is 202].
We end this section by looking at an example where, after an interruption, Team 1 resume their innings.
Example 12: Team 1 are 115/3 in 30 overs, when 10 overs are lost. The match is reduced to 40 overs for each team, and Team 1 close at 180/8 in their 40 overs. What is Team 2's target in 40 overs?
During the first ("normal") phase of 30 overs (30/50=60% overs), involving the loss of 3 wickets, Team 1 reach 51.4% of their expected score. If there had been no interruption, Team 2 would have used the remaining 20 overs to hit off the (100-51.4) = 48.6% remaining runs. Because of the interruption, Team 1 cannot score all of these remaining 48.6% runs. But, with fewer overs remaining to expend the same number of wickets, Team 1 will now score faster. What per cent of the remaining 48.6% runs can Team 1 now score? Note that after the interruption Team 1 are left with only 10 out of the remaining 20 overs (10/20 = 50% overs). The target run% for 50% overs is 63.4%. So Team 1 would be expected to score (48.6 x 63.4)% = 30.81% of its total score in the last 10 overs. Adding things up, we conclude that the interruption caused Team 1 to score only 51.4 + 30.8 = 82.2% of its expected final score. Team 2 have no such problems. Right from the start they know that they will get only 40 (40/50 = 80%) overs. The target run% for 80% overs is 87.6% (see the J table extract). Team 2's winning target would therefore be 180 x (87.6/82.2)% = 191 runs. This upward revision is reasonable because Team 1 were disadvantaged more by the interruption. [The corresponding D/L target is 202].
More than one interruption while Team 2 are batting
A critical requirement of any LOI target resetting method is the ability to handle multiple interruptions. Most of the predecessors of the D/L method failed miserably on this count; D/L, on the other hand, performs most admirably. In this section we will see how the Jayadevan method handles multiple interruptions while Team 2 are batting.
Consider the following example:
Example 13: Team 1 score 250/6 in 50 overs. In reply, Team 2 are 100/3 in 20 overs when an interruption reduces Team 2's innings to 40 overs. After batting 35 overs, Team 2 are 185/6 when the match has to be stopped. Who wins: Team 1 or Team 2?
In the first ("normal") spell of 20/50 = 40% overs, and following the loss of 3 wickets, Team 2 should have scored 39.7% of their total runs (see J table), yielding a par score of 250 x 39.7% = 99.25 runs (so, having reached 100/3, Team 2 are winning by a whisker at the 20-over mark). When Team 2 return for their second batting spell, they are expecting to bat for 20 out of the remaining 30 overs, i.e. for 20/30 = 66.7% of the remaining overs. The target run% corresponding to 66.7% overs is 77.7%. Team 2's par score for the second batting spell is therefore (250-99.25) x 77.7% = 117.13 runs. Unfortunately, there is a second interruption after Team 2 have batted for 35 of the 40 possible overs, and the match is called off. The par score of 117.13 for the second batting spell must therefore be scaled down. Team 2 started the second spell after already batting for 20/40 = 50% of their overs and having lost 3 of their wickets. So (looking at the normal run% in the J table) they had scored 44.3% of their total runs, and would have scored the remaining (100-44.3)% runs during this spell. When the second interruption occurs, Team 2 have played 35/40 = 87.5% of their overs and lost 6 wickets. So (looking at the normal run% of the full J table) they have scored 87.1% of their total runs. Instead of scoring the (100-44.3)% remaining runs, they could only score (87.1-44.3)% of the remaining runs. J therefore scales down the par score of 117.13 by (87.1-44.3)/(100-44.3) to get 117.13 x 0.77 = 90.00. Team 2's winning target is therefore 99.25 + 90.00 = 190. So at 185/6 in 35 overs, Team 2 lose. [Using D/L, Team 2 win at 183/6].
Before we proceed, let me quickly clarify a small detail (which might be bothering some readers). We write that when the first interruption occurs after 20 overs, "Team 2 have scored 39.7% of their total runs". Later, when Team 2 begin their second batting spell, we write that "they have scored 44.3% of their total runs". A "dumb" doubt can be: "how did this percentage suddenly go up?". The answer is of course simple: the loss of overs means that Team 2's final score will comes down. So while Team 2's actual score doesn't go up, its percentage in relation to the total final score does go up.
Example 14: In a LOI match played in April 1999 at Bridgetown, Australia scored 252/9 in 50 overs. In reply, West Indies (WI) were 138/1 after 29 overs when 10 overs were lost. WI were set a modified target of 196 in 40 overs by the D/L method which they reached comfortably, scoring 197/2 in 37 overs. Assume that WI gets to 172/3 after 35 overs when two more overs were lost. What would be the revised winning target for WI in 38 overs?
In the first batting spell of 29/50 = 58% overs, WI bat "normally". The normal run% in 58% overs for the loss of 1 wicket is 48.4%. So the par score at this stage is 252 x 48.4% = 121.97 (so, being 17 runs ahead, WI appear to have already taken control of the match). After the interruption only 11 out of the remaining 21 overs can be bowled. The target run% corresponding to 11/21 = 58.4% overs is 65.6%. So WI's par score for the second batting spell is (252-121.97) x 65.6% = 85.3 (the J method would therefore have set WI a higher target of 121.97+85.3 = 207.27, i.e. 208 runs). When WI start their second batting spell, they have played 29 out of the possible 40 overs and lost 1 wicket. The normal run% for 29/40 = 72.5% overs with 1 wicket lost is 62.3%. There is now a second interruption at 172/3 after 35 overs. The normal run% for 35/40 = 87.5% overs with 3 wickets lost is 80.6%. The WI par score for the second spell must therefore be scaled down as follows: (80.6-62.3)/(100-62.3) x 85.3 = 41.4. So the par score after 29+6 overs is 121.97 + 41.4 = 163.4 (since WI were 172/3, they were winning when the second interruption occurred). We must now calculate the par score for the third batting spell. In this spell, WI must bat for the last 3 of the 15 remaining overs. Our par calculation required WI to score 207.27-163.4 = 43.87 runs in the last five overs. Since only three overs can now be bowled, we are looking for a suitably scaled down value of 43.87. To ensure that his target is "internally consistent", Jayadevan recommends that the scale down factor should be the target run% for 3/15 = 20% overs (29.8%) divided by the target run% for 5/15 = 33% overs (46.16%). The WI par score for the third batting spell is therefore 43.87 x (29.8/46.16) = 43.87 x 0.646 = 28.34. Adding up the par scores for the three spells we get 121.97+41.40+28.34 = 191.71, i.e. 192 runs. (WI must therefore get 20 runs in the last 3 overs to win, which should be quite easy).
More than one interruption while Team 1 are batting
The following examples illustrate the situation when there are multiple interruptions while Team 1 are batting; in particular, the second example discusses the New Zealand vs South Africa LOI match played in October 2000.
Example 15: In a 50-over match, Team 1 are 90/2 after 20 overs. At this stage, the match is reduced to 35 overs for each side. Team 1 continue batting and are 160/6 after batting 30 overs when a second interruption occurs. Team 1's innings is terminated and Team 2 are required to be set a winning target in 30 overs.
Team 1 start their innings batting "normally". After 20/50 = 40% overs, and the fall of two wickets, Team 1 have (see J table extract) scored 36.5% of their expected total score. Following the first interruption only 15 of the remaining 30 overs can be bowled. The target run% for 15/30 = 50% is 63.4. So, instead of scoring the remaining (100-36.5) = 63.5% in the remaining 30 overs, Team 1 will now get to score only (63.5 x 63.4)% = 40.3% of the score in the 15 remaining overs. [So, effectively, Team 1 can hope to score only 36.5 + 40.3 = 76.8% of their total score in 35 overs]. But there is now a second interruption after 10 of the 15 remaining overs have been bowled! So Team 1 will now score less than the expected 40.3% in the second batting spell. How do we scale down the value? Let us argue as we did in Example 13: when Team 1 started their second batting spell they had already batted for 20/35 = 57% of their overs and had lost 2 wickets. So (looking at the normal run% in the J table) they had scored 48.8% of their total runs, and would have scored the remaining (100-48.8)% runs during this spell. When the second interruption occurred, Team 1 had played 30/35 = 86% of their overs and lost 6 wickets. So (looking at the normal run% of the full J table) they have scored 85.7% of their total runs. Because of the second interruption, Team 1 could only score (85.7-48.8)% of the remaining runs instead of (100-48.7)%. J therefore scales down 40.3% by (85.7-48.8)/(100-48.8) to get 40.3 x 0.72 = 29.04%. So, adding up, Team 1 have the opportunity of scoring only 36.5 + 29.04 = 65.54% of their total score in 30 overs. Team 2's target run% in 30/50 = 60% overs is 72.3%. Since Team 2 have the advantage, the J method requires their target to be scale up; Team 2 must therefore score 160 x (72.3/65.54)% = 177 runs in their 30 overs.
[The corresponding D/L target is 197].
Example 16: Batting first, New Zealand (NZ) are 81/5 in 27,2 overs when there is a one-over interruption. On resumption, NZ reach 114/5 after 32,4 overs when their innings is terminated. South Africa (SA) can bat for 32 overs in reply. What should be SA's winning target?
For the first 27,2 overs (27.33/50= 54.7% overs), NZ bat "normally". The normal run% corresponding to 54.7% overs and the loss of 5 wickets is 60.9% (from full interpolated J table). If there had been no interruption, NZ would have been expected to hit the remaining (100-60.9) = 39.1% runs in the last 22,4 overs. Following the brief interruption, however, only 21,4 of the remaining 22,4 overs can be bowled. The target run% corresponding to 21.67/22.67 = 95.8% overs is 97.8%. So NZ can now only score (39.1 x 97.8%) = 38.24% of their total score in the second batting spell (so effectively NZ can only score 60.9 + 38.24 = 99.1% of their expected score following the one-over interruption). But NZ's second batting spell can continue only till the 32,4-over mark. NZ, therefore, did not get the opportunity to score all of its expected 38.24% runs in the second spell. So we must scale down this percentage. Note than when NZ started their second batting spell they had already batted for 27.33/49 = 55.78% of their overs and had lost 5 wickets. So (looking at the normal run% in the J table) they had scored 61.6% of their total runs, and would have scored the remaining (100-61.6)% runs during this spell. When the second interruption occurred, Team 1 had played 32.67/49 = 66.7% of their overs and lost 5 wickets. So (looking at the normal run% of the full J table) they had scored 69.0% of their total runs. Because of the second interruption, Team 1 could only score (69.0-61.6)% of the remaining runs instead of (100-61.6)%. So NZ could, in effect, only score 38.24 x (69.0-61.6)/(100-61.6) = 7.4% in their second spell. Adding this to the 60.9% which they could score in the first spell, NZ could only score 60.9 + 7.4 = 68.3% of their expected total score in 32,4 overs. SA's target run% in 32.67/50 = 65.3% overs is 76.7% (from full J table). So, in the same 32,4 overs, SA can score 76.7% of their total score, while NZ could only score 68.3%. NZ is disadvantaged, so SA's target must be scaled up to 114 x (76.7/68.3)% = 128.02 runs. But since SA get only 32 instead of 32,4 overs, this target must be scaled down by the target run% corresponding to 32/32.67 = 97.95%, which is 99.3%. So SA must score 128.02 x 99.3 = 128 runs to win.
[The corresponding D/L target is 153].
Discussion
Our exposition of the Jayadevan method is finally over. The sixteen examples that we have discussed cover practically every conceivable interruption situation in LOI cricket. A "ready reckoner" of the J method, summarizing the target resetting procedure in every situation as a set of mathematical rules, is available. In fact, early versions of this article had such a ready reckoner appended at the end of the narrative.
The underlying principle of the J method (as, indeed, of the D/L method) is to consider individual batting spells of interrupted innings and calculate the par score for each spell.
I believe that the greatest merit of the J method is that it gives very reasonable targets in almost all situations. The calculations can get a little involved if there are multiple interruptions, although Jayadevan re-assures me that it is simply a matter of getting used to the method.
One of the debates in all this target resetting business is: what should be the "trade-off" between reasonable targets and ease of calculation? Ten years ago (before the D/L method and its predecessors, such as the "most productive overs" method used in the 1992 World Cup, were introduced), it was simply a question of looking at which team had the higher run rate ("total runs scored divided by total overs faced"). This method often gave unreasonable targets because it didn't take into account the number of wickets lost. The D/L method achieved, for the first time, a "good" trade-off; it give vastly more reasonable targets without making calculations too difficult. Jayadevan has achieved another "good" trade-off. He acknowledges that his calculations, especially for multiple interruption situations, are more complicated than D/L calculations, but he claims that he obtains more reasonable targets than D/L.
So is the Jayadevan method good enough to replace the D/L method which is currently in use? I shall try to answer this question in my second article.
Acknowledgements
It has been enjoyable to introduce the J method, although it took much longer than I expected. I am grateful to Jayadevan for responding promptly to my numerous doubts and queries. Frank Duckworth and Tony Lewis read successive drafts of this article and their detailed reactions (which I conveyed to Jayadevan) have significantly improved the J method; I thought that it was absolutely wonderful of D/L to do so when they were aware that Jayadevan was a potential rival. I would also like to thank Prem Panicker for immediately agreeing to "host" this article on Rediff. I just hope that readers don't find it too long.
Is Jayadevan's proposed method better than the Duckworth/Lewis method?