

There are many lessons to learn from the 2008 market crash. One of the most important is: understand a company before investing in it. If you do, the market is offering a good chance to pick quality stocks at reasonable prices.
The problem is that without sound information, any investment decision would be based on weak reasoning and is unlikely to support your overall portfolio performance.
But how do you know that the information you have is accurate? For that, you need to do your research well and look at the right place for the right information. Here are seven parameters you should look at and the places you can find information on them. Check them out...
Text: Pornima Kavlekar, Outlook Money
Powered by 
7 ways to get right info on right stocks
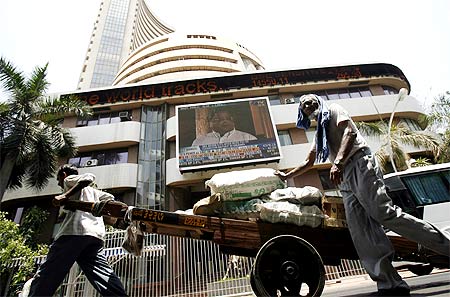
Photographs: Punit Paranjpe/Reuters
1. Market Capitalisation
What is it?
Market capitalisation (cap) is calculated by multiplying a company's outstanding shares (paid-up equity capital divided by the face value) with the current market price (CMP). This indicates the worth of the company in terms of its shares. To calculate the market cap of, say, GlaxoSmithKline (GSK) Consumer Health-care, multiply the CMP -- Rs 815 as on 13 May -- with the 4.20 crore (42 million) outstanding shares, which comes to Rs 3423 crore (Rs 34.23 billion).
Where to look
- The financial results section or the company related page on stock exchange websites (www.nseindia.com or www.bseindia.com) give details of outstanding shares
- The quotes page on these sites give CMP
- Financial dailies publish market cap data of select companies
Powered by
7 ways to get right info on right stocks

2. Trading Volumes
What is it?
It is the total number of stocks of a company traded at an exchange. It is a measure of the liquidity and also shows the level of market participation in the stock. This figure is especially important in the case of low-volume stocks (below 2,000 shares). During tough market conditions, liquidating low-volume stocks becomes difficult. The 2-week average quantity of Dabur India shares is around 2.2 lakh, which is a comfortable number. On the other hand, the number for MMTC is only 500-600 shares for the same period.
Where to look
- Stock exchange sites
- Financial dailies
Powered by
7 ways to get right info on right stocks
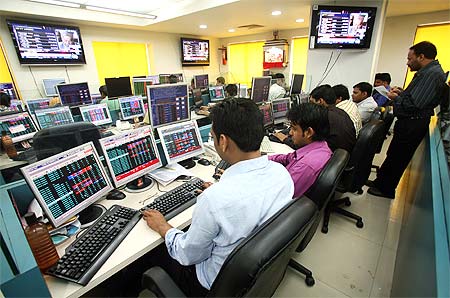
Photographs: Jayanta Shaw/Reuters
3. Historical Price Data
What is it?
This information helps understand how a stock's price has behaved over a period of time. Information on whether a stock is at a new peak or a new low helps evaluate the quality of the stock. For instance, if a stock has breached its yearly low, you should get into the reason behind it.
Where to look
- The quotes page or the stock reach page on the NSE and BSE sites share the yearly high and low data
- Use the 'charting function' of exchange sites for graphical representation. This will help you find whether the stock is trading at a new low or a new high. The co-movement option helps compare the performance of the stock with the index
- On www.nseindia.com, go to the equity, market information, historical data section. Click on the security-wise data section, get the security symbol and choose the dates for which you want information. On www.bseindia.com, go to the archives section
Powered by
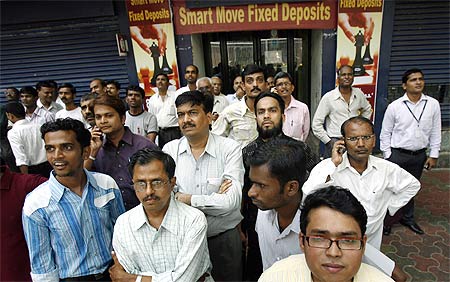
7 ways to get right info on right stocks

Photographs: Punit Paranjpe/Reuters
4. Company Developments
What is it?
Developments in a company such as a new product, capacity expansion or a new clientele can affect the stock's performance. Find out what impact these developments can have on the stock. Also, find out about the company's competitors, government regulations related to it, and their impact on its operations.
Where to look
- Financial dailies
- Corporate announcements on exchange sites have information about developments in a company
- Analyst meets or conference call updates on company sites throw light on the company's future plans
- To understand the operations of a company, read its latest annual report. The director's report and management discussion and analysis will give you a detailed perspective on the company's current performance and outlook
- Follow the notes published at the end of the statutory advertisements that companies release to gather information on disclosures
- Investors can also become a member of online investment clubs. You will derive a lot of information which can, subsequently, be validated from a reliable source
Powered by
7 ways to get right info on right stocks

Photographs: Punit Paranjpe/Reuters
5. Financial Data
What is it?
Before buying a stock, it is important to know about the company's financial performance. Growth in sales and profit over the last four to five quarters will help you understand its performance in the light of the recent market scenario. Its growth rate in the last 4-5 years will give an insight into the pace of growth in the past. Look at the operating margin growth as well, especially so in the current tough operating environment.
Remember to look at the consolidated, and not the standalone performance. Consolidated performance includes the results of all subsidiaries, joint ventures and investments in associate companies. Its importance is evident from the impact it has on the performance of some companies.
Where to look
- Company website. Results and annual reports need to be read carefully. For example, in case of Dabur India, go to www.dabur.com, click on investor relations and get into financial presentations. You will get quarterly results, annual report, investor communications and analyst conference call transcripts there
- The financial results section on stock exchange websites
Powered by
7 ways to get right info on right stocks

Photographs: Amit Dave/Reuters
6. Balance Sheet
What is it?
Many companies, especially those from the pharmaceutical and IT sectors, are under stress due to high debt and losses on foreign currency borrowings. Many investors ignored the foreign currency convertible bond (FCCB) details before the 2008 stockmarket crash.
FCCB is a type of convertible bond issued in a currency different from the issuer's domestic currency. The mix of debt and equity instruments it has gives the bondholder an option to convert the bond into a stock.
Due to the sharp stockmarket dip, the companies are unable to offer the bondholders the option of converting the bonds into equity at a premium. Instead, bondholders had to exercise the debt option. Companies would now have to decide on how to service their FCCBs.
The balancesheet will also help you understand the financial leveraging capacity of the company. Calculate the debt-equity ratio to get this. It is arrived at by dividing the total liabilities by the stockholders' equity.
Take the case of Aurobindo Pharma. It has outstanding FCCB of $260 million. A part of it will come up for redemption in the beginning of 2010. This stock got butchered when the FCCB issue became a major concern and is currently trading at more than 80 per cent discount to its FCCB conversion price.
Recent updates on the NSE website suggest that the company has plans to buy back its outstanding FCCBs in small lots. The company's debt-equity ratio is 1.5. This should be considered before investing because high debt-equity (normally above one) suggests that the company has been aggressive in financing its growth through debt. If the company's operation is under stress due to the economic environment and its balancesheet is debt-burdened, then it would be better to stay away from its stock.
Where to look
- Annual report and news releases on the company website
- Corporate announcements available on stock exchange sites
Powered by
7 ways to get right info on right stocks
Photographs: Punit Paranjpe/Reuters
7. Basic Calculations
Deduct any preferred stock dividends from the net profit after tax and divide the balance by the number of outstanding shares. This will give you the earnings per share (EPS) of a company.
To assess a stock, calculate the trailing 12 months' EPS (for the last four quarters). Then, calculate the price earning ratio (PE) -- CMP divided by EPS.
For example, GSK Consumer's EPS grew steadily from Rs 30 in December 2006 to Rs 51.30 in March 2009. The company follows the calendar year and this data can be sourced from the exchange sites and also the company's website, www.gsk-ch.in. The latest EPS and CMP (Rs 815) translate into a PE ratio of 15.9.
To evaluate whether a PE is high or low, compare it with the industry PE and index PE. This data is also available on exchange sites. Go to the industry index information to get the PE details of a particular industry. The BSE FMCG Index's PE, for instance, as on 13 May is 23.54 while GSK Consumer's PE is 15.9. This suggests a comparatively low PE for the company.
Where to look
- Profit & loss account on exchange sites or company website
- Quarterly or annual results published by the company also carry EPS information
Powered by
article