Keep exit plans handy, D-day could be the second week of August, writes Sonali Ranade in Market Notes.
I had ventured to suggest that the last correction may not be the beginning of a intermediate one and that we will have a subsequent shy at new tops. That scenario appears to be working out. Nasdaq 100 has already made a new high, SPX is pretty close to one, and others such as Nikkei, Shanghai and Nifty are not far behind. But I had also suggested that this rally may be the last before a substantial correction. I maintain that view unless the new highs are five to six per cent higher than previous tops. So keep exit plans handy. D-day could be the second week of August.
There is a rather lengthy note on the $-INR in this article. I have always argued that our whole foreign trade and foreign exchange management are riddled with flawed assumptions, not so much for lack of knowledge and understanding, but rather to protect vested interests. Cotton exports against lower cotton prices for local manufacturers is the sort of problem at one end of the spectrum. The failure to see value-addition as the key variable of domestic prosperity rather than the absolute export numbers is the other.
Take cotton. What are we exporting? Sunshine, water, labour and some fertiliser and pesticide. What do spinners add to cotton by spinning it into yarn? Barely 10 pc at enormous cost. But if you take the distribution of profits between growers and spinners, the lion's share goes to the spinners. Such is the perversity of our economy. Forex has been the key fulcrum on which the edifice to transfer wealth from farmers to industry was built under the socialist raj. The apparatus is still largely intact. Most economist know of it. Nobody talks of it.
No change in the prognosis on Nifty. Use the counter-trend rally to exit.
Happy trading.
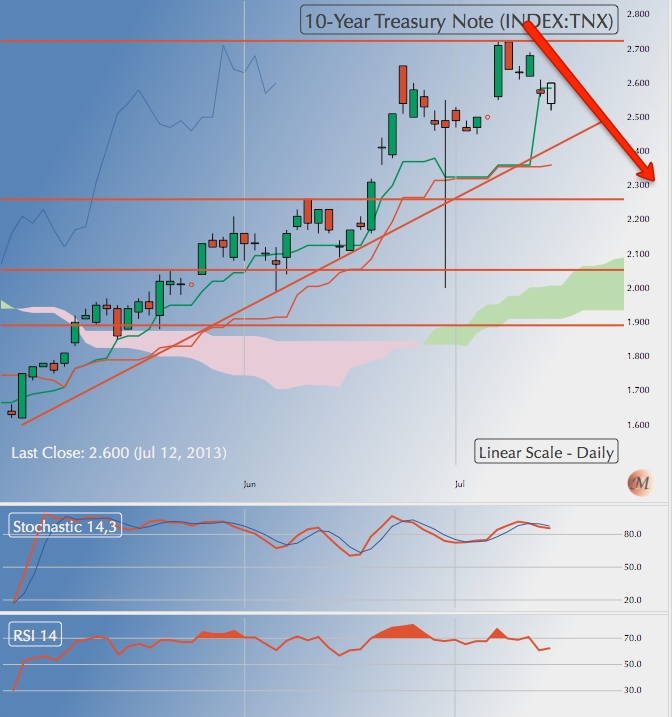 Yield on 10-year Treasury Notes: The yield on 10-year treasury notes continued at elevated levels but moderated a bit, closing the week at 259 basis points after having made a high of 274. On the long term weekly charts, 280 basis points appears to be a good place to pause from some consolidation before the uptrend resumes. The climb in yields has been pretty steep since May. We could have a few weeks of consolidation with yields dropping back to around 200 bps as the correction sets in.
 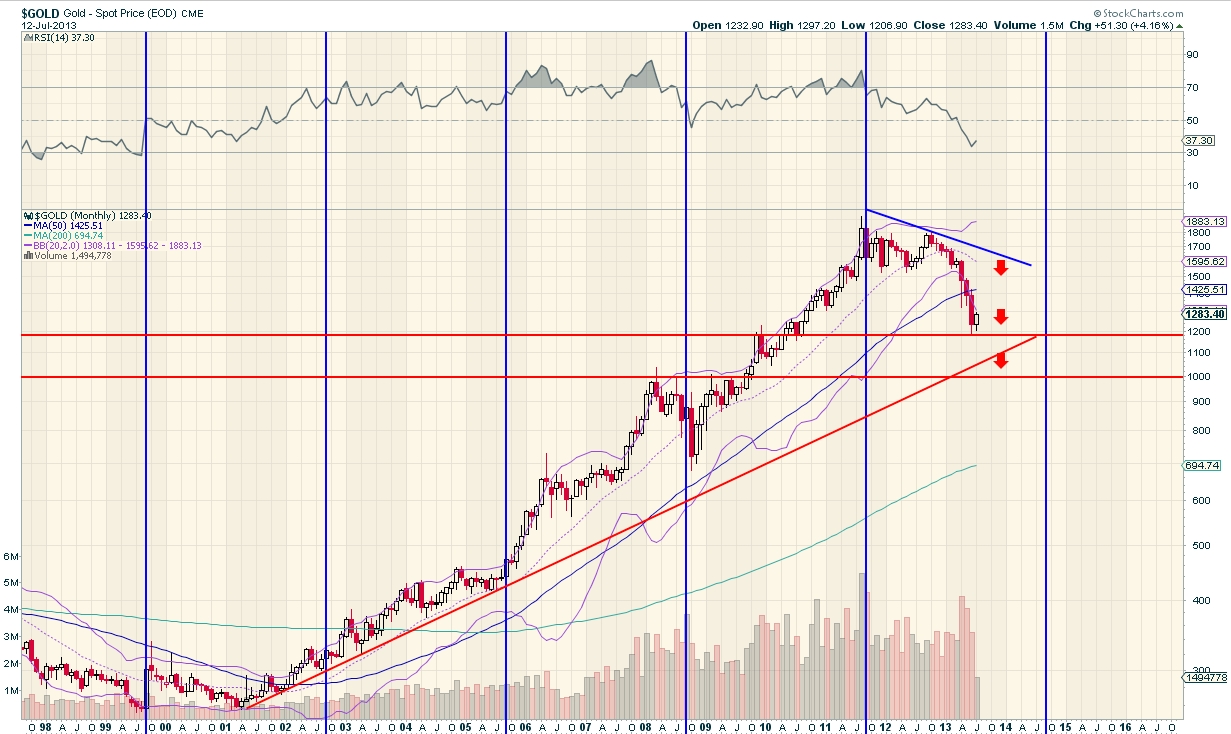 Gold: Gold continues to surprise to the downside. It closed the week at $1277.60 after rallying from a new low of 1212.10. The monthly chart of gold prices here shows that while $1160 was a support area, gold is more likely to test the $950 area before it finds some solid support from long-term, long-only investors. The wave counts, the support line for the long-term uptrend support line and the fractal being traced out by gold prices, all point to further weakness in gold prices. There is plenty of time for gold prices to drift down as well. Indians would be wise to leave the metal alone for some time but then I have been warning of a bear market in gold for the past two years and more. Don't see a significant rally in gold prices until after March 2014.
 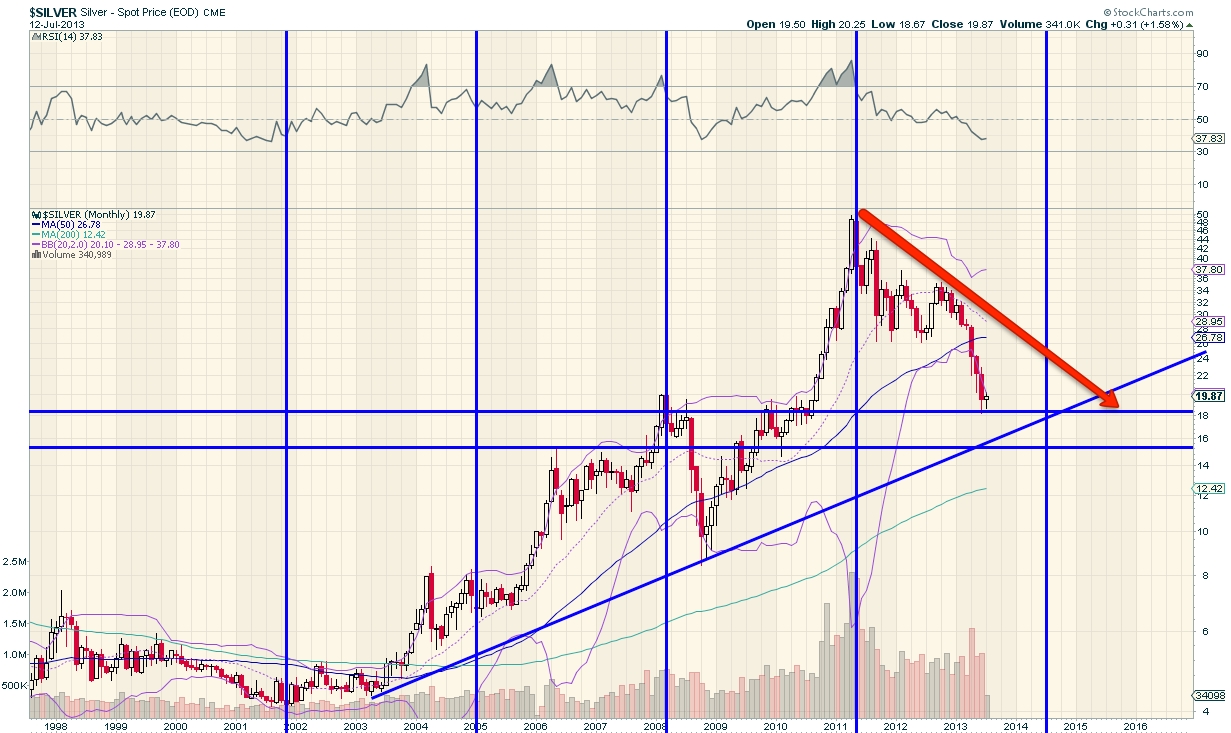 Silver: Silver's first major support zone was $20, made a low of $18.17 before staging a minor rally to $20.25, closing the week at $19.792. The monthly chart here shows the next major support for silver is at $14 and it has plenty of time to get there. I don't think the metal will find any significant rallies from here until it test $14 although it can hang around current levels for a while.
 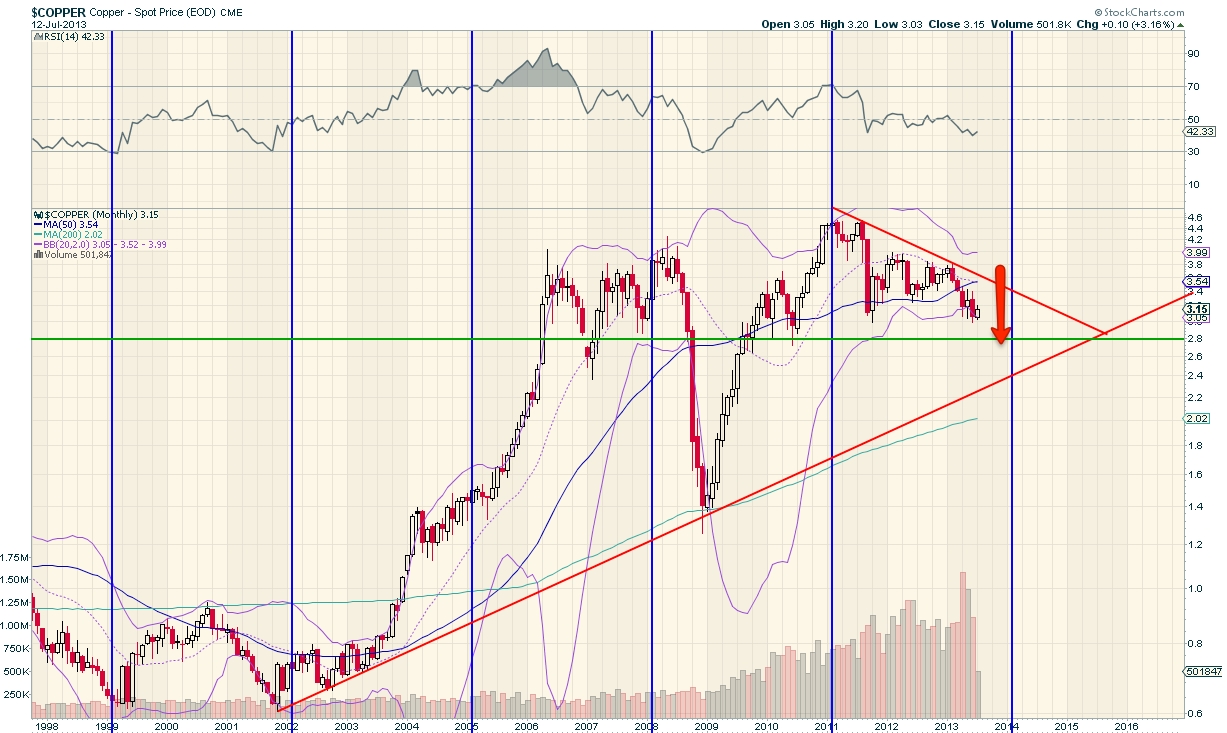 HG Copper: Copper has been rather reluctant to test levels below 3.0 and has bounced back from the region on several occasions in the past. My sense is that while copper has more or less finished its price correction, it could mark time in the 2.80 to 3.40 price region before staging a significant rally. Definitely not a metal to short at these prices.
 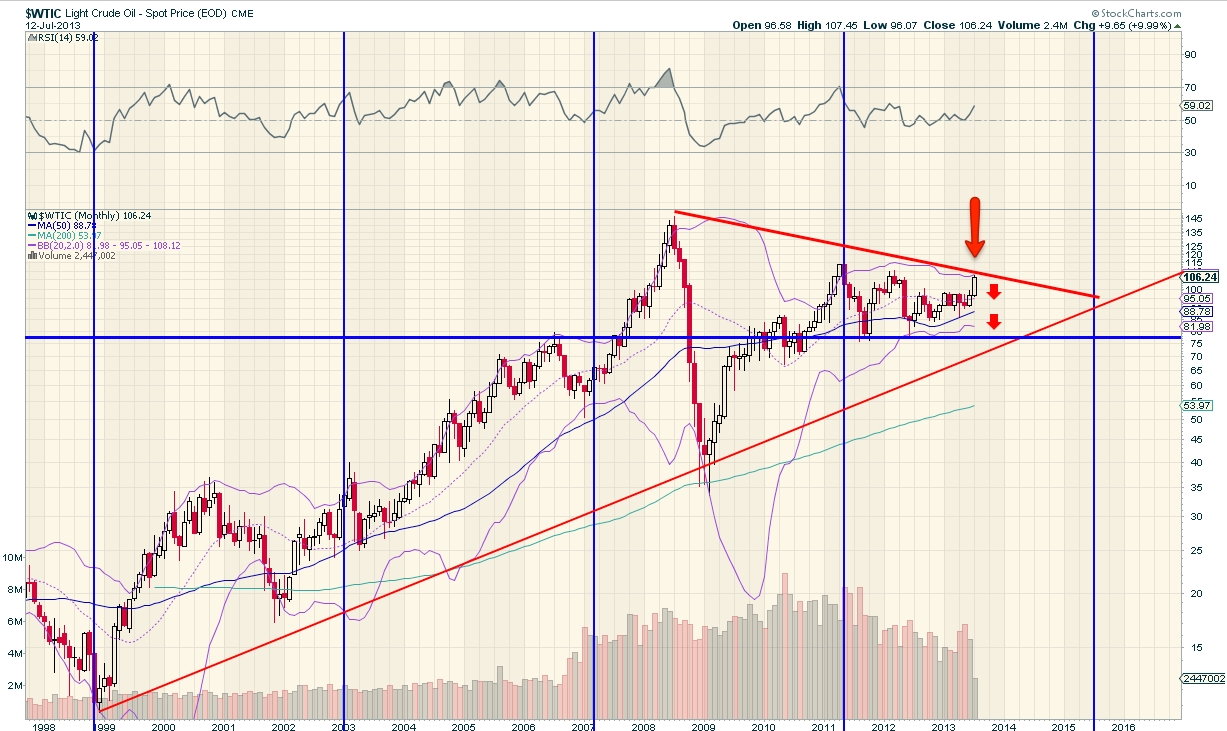 WTI Crude: WTI crude's price has been trending up on thinner and thinner volumes for the past two years. That fact alone should make one very wary of the WTI crude chart. The second fact that puts crude's long-term chart out of kilter is the fact that it peaked in 2007, long before the rest of the commodities did so. In my view that is significant price "failure" on the long-term charts and crude's rather anomalous price behaviour points to the same fault line. There is no doubt in my mind that the technicals point to a price of WTI crude in the $80 region in the intermediate term ahead.
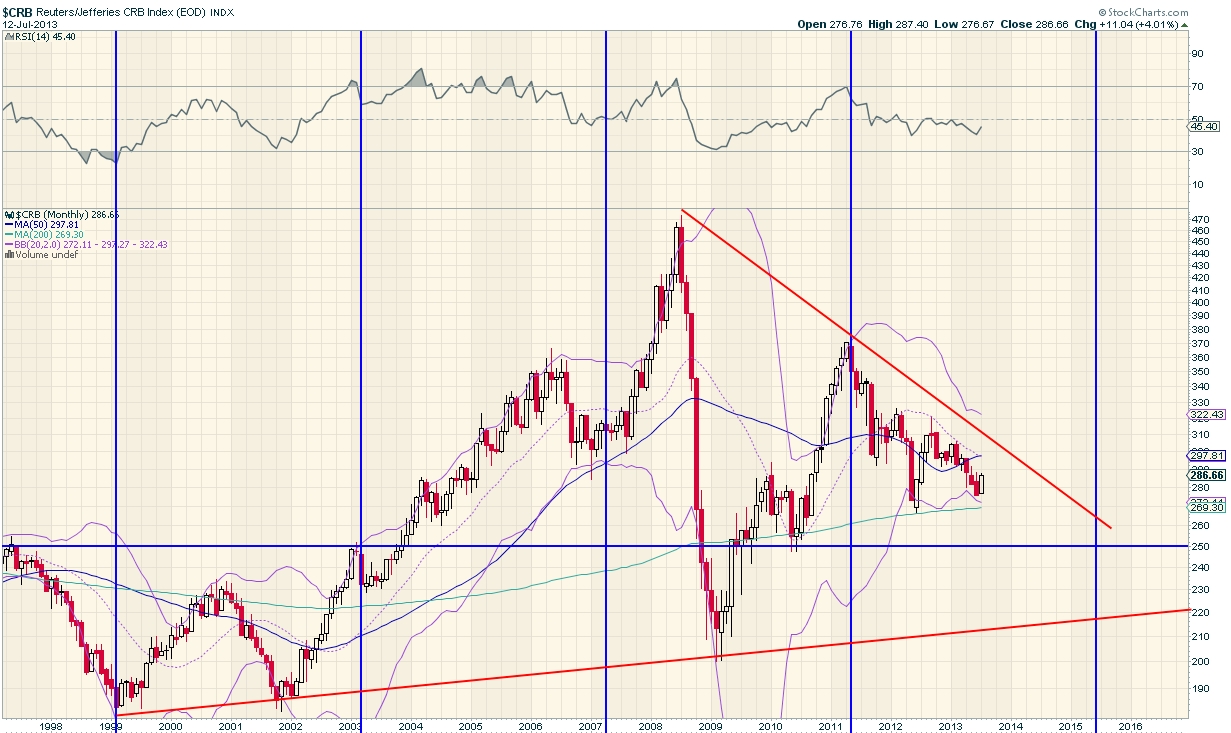 Reuters CRB Index: The CRB Index puts the triangulation underway in commodities into global perspective. The index itself has little predictive value but it does confirm the notion that triangulation in the open auction markets is perhaps the only way to true price discovery. Note the 250 support line for the index. With the index poised at 270, we are not far from support. My sense is agricultural commodities will recover way ahead of the industrials and precious metals. But that's a subject for another day. Long-term bears will be looking to exit shorts in most commodities.
  US Dollar Index [DXY]: This article is all about underlying long-term trends since markets appear to be approaching an inflection point. Who looks at monthly currency charts in markets? Well, I do and it's very instructive to place things in perspective. First note that the DXY bottomed out in 2008 and then confirmed that bottom in 2011. It's been in an uptrend since then and those surprised by my bullishness on the $ for the past two years contrary to all conventional wisdom now know why. That uptrend is about to end. If it ends now, or after another six months, is the moot question.
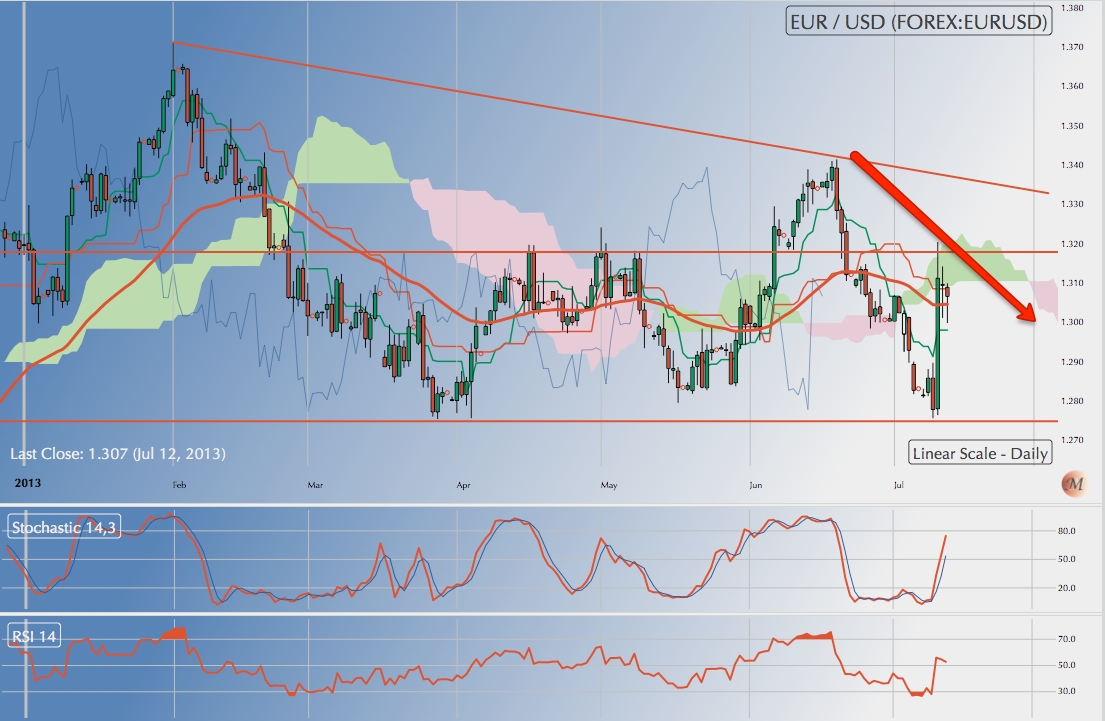 EURUSD: The EurUsd staged a smart counter-trend rally from the 1.27 price region to 1.32 before closing the week at 1.3066, sandwiched between its 200 and 50 DMAs. The rally from 1.27 upwards was reactive and the correction underway from 1.37 in February is far from over.
 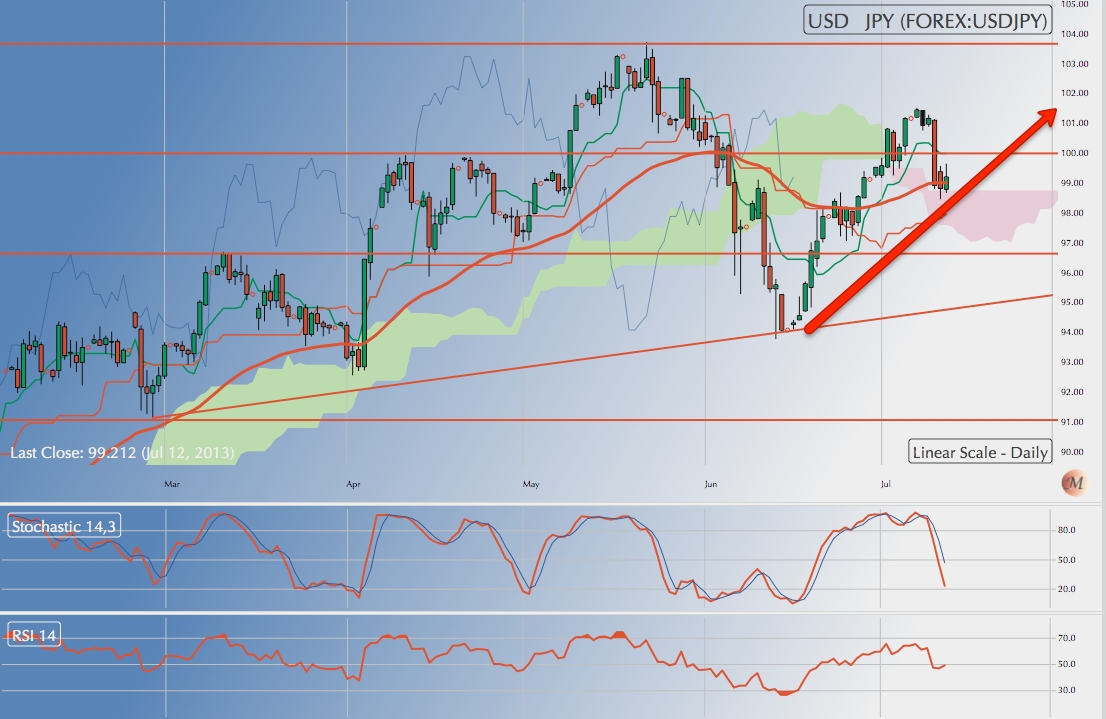 USDJPY: UsdJpy closed the week at 99.21, a shade below its 50 DMA at 99.50. Recall UsdJpy bounced back from 94 after falling from a significant new top at 103.60. While the bounce from 94 is corrective in nature, and therefore we will see sharp corrections on the way up, my sense is that the corrective way is exhibiting sufficient strength to show higher top than 103.60; something one wouldn't expect in a cup-and-and-handle correction from 103.60.
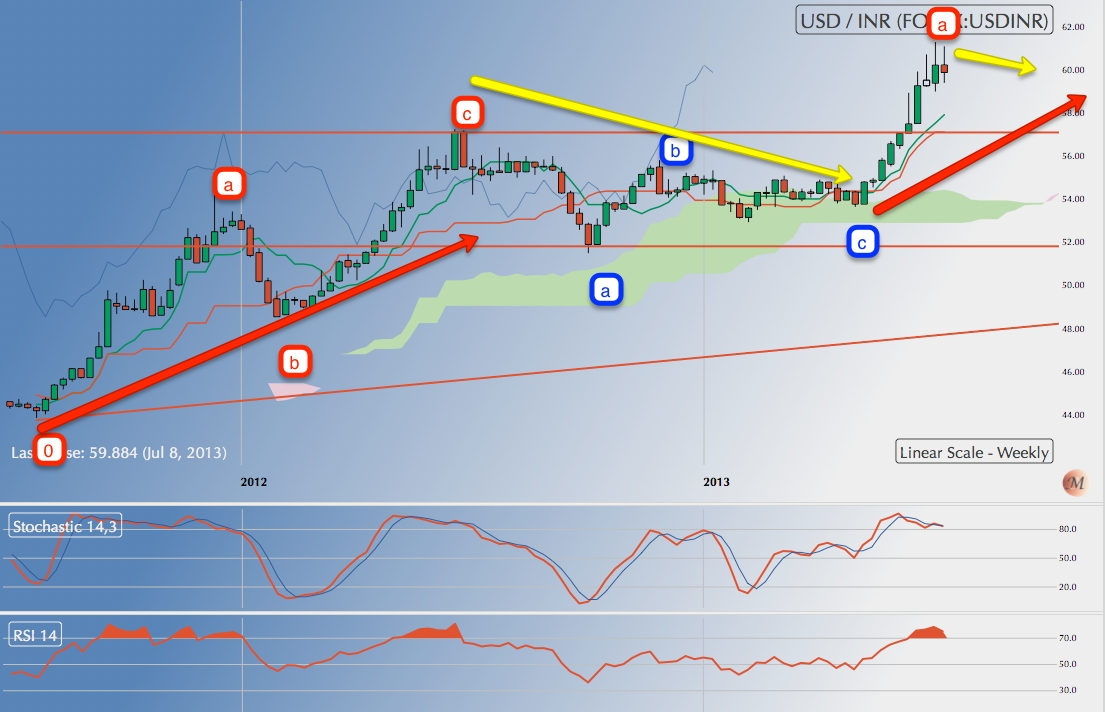 USDINR: My data vendor anbd charting service let the DXY, EurUsd, UsdJpy and UsdInr in particular fall between their two stools. One doesn't have the data and the other charts! So excuse the charts and follow the narrative carefully using whatever charts you have to track prices. For I am going to show you why I think UsdInr will be close to 70 by the end of this year.
 DAX: The DAX closed the week at 8212.77 a whisker above its 50 DMA at 8173. So far the DAX is behaving as expected. Wave counts favour a retest of the recent top at 8550. In fact, we could have a higher high. But unless the higher high is at least five to six pc higher than 8550, the subsequent correction that follows in mid-August could tip the index into an intermediate correction. Look to exist. Sometimes the risk is simply not worth the potential return.
 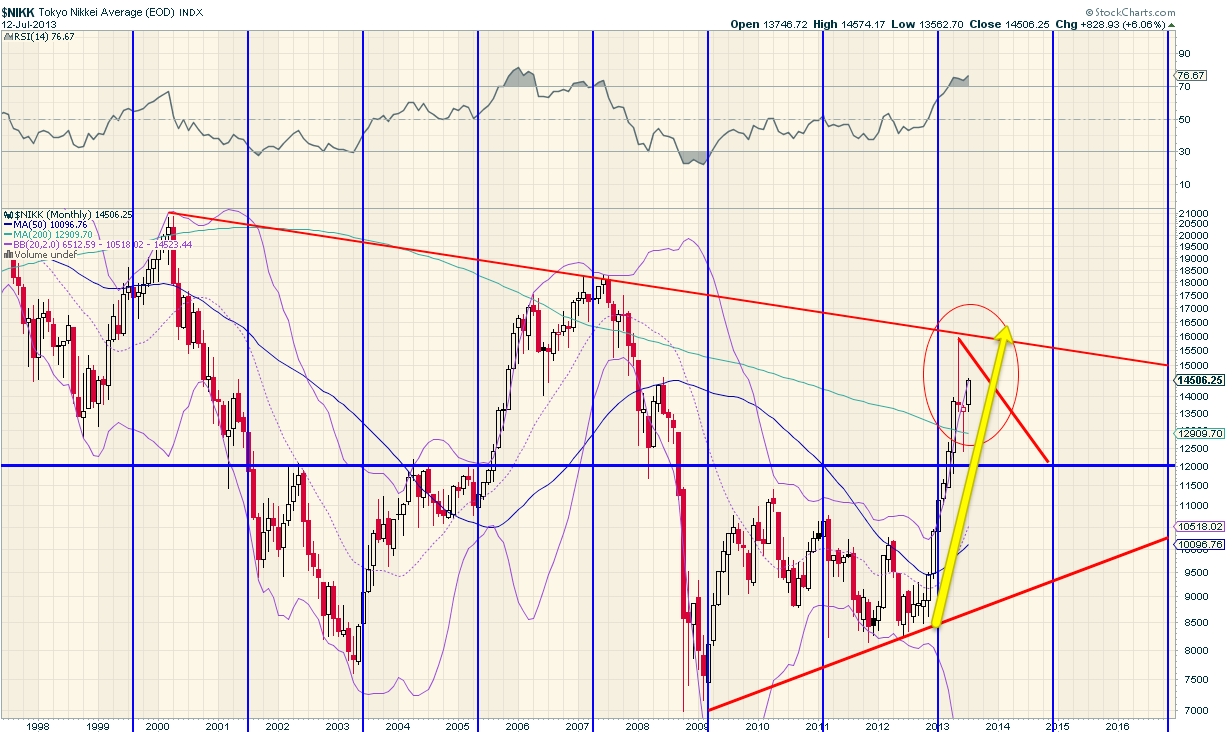 Nikkei 225: The monthly chart here clearly lays out the neat arrangements made for a new high by the managers of Nikkei 225 even as it corrects from the recent top of 15962. In the initial phases of a bull move, dip buying by left-out bulls often lends a momentum to markets greater than the initial impulse. In the normal course one would expect a cup and handle correction to the rally from 8180 to 16000 which is basically wave I of a new bull super cycle for Nikkei. However, by going into a correction slightly earlier than expected and from the down-sloping bearish trend-line a trap has been laid for bears. If enough get trapped, their covering alone will ensure a new high. Note the candle to 16000 without a body but a huge spike. Price without buying, which points to the bulls' intention to return after the bears have been trapped. So avoid shorts on the Nikkei. In any case it is in a correction with little downside until the B up currently underway exhausts itself. Note the time element. A new high would sync with SPX also due for a new high mid-August. Hint, hint.
 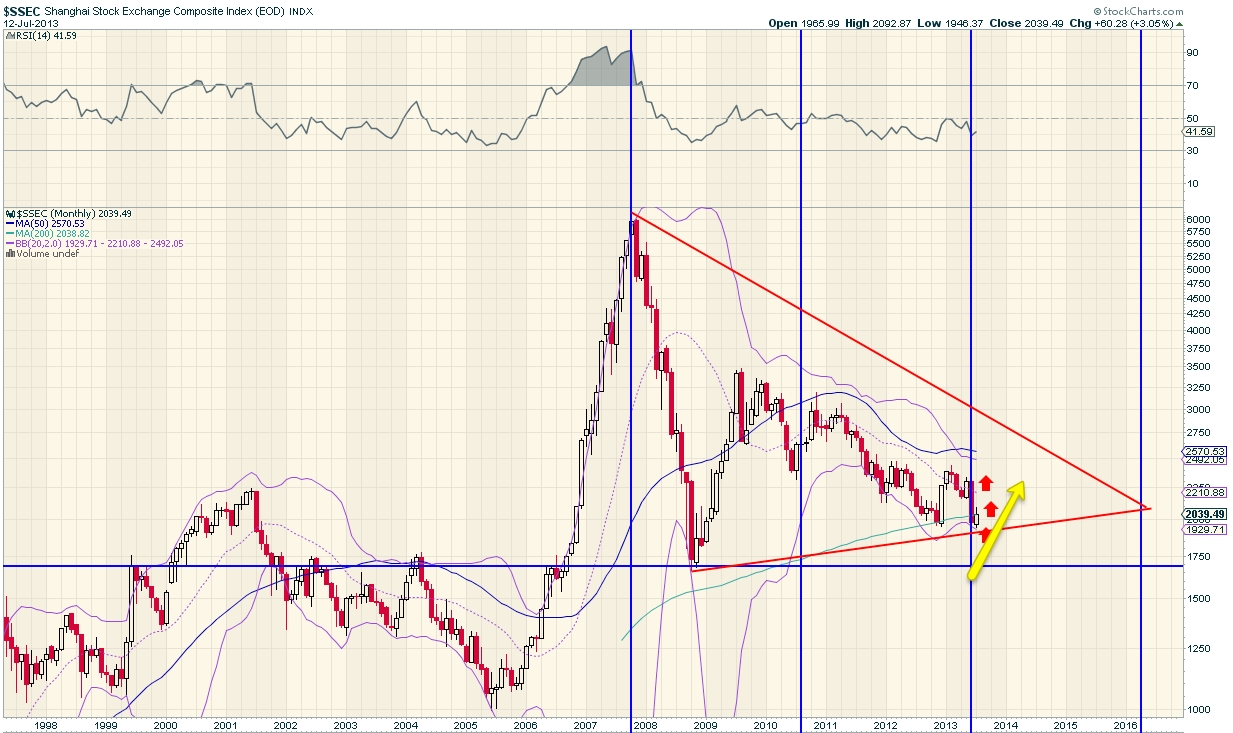 Shanghai Composite: As mentioned earlier by me, Shanghai has completed the second leg of its correction from the top of 6060 and has now caught a counter-trend rally up that could eventually test 2450. It is not yet the beginning of a new bull move although it might look like it. China has a lot of time correction to go through although the price correction is now over. All the same it is a nice tradable rally and the downturn can easily coincide with world markets come mid-August. So don't be late to the party and get caught.
  Nasdaq 100: You get such long duration rallies as in the Nasdaq 100 only from an absolute nadir which is what the low of 2009 was for the index combining the low of both the correction for the bubble and the crash of 2008. In any case, the warning is clear enough. We are well into a mature rally that is ripe for correction.
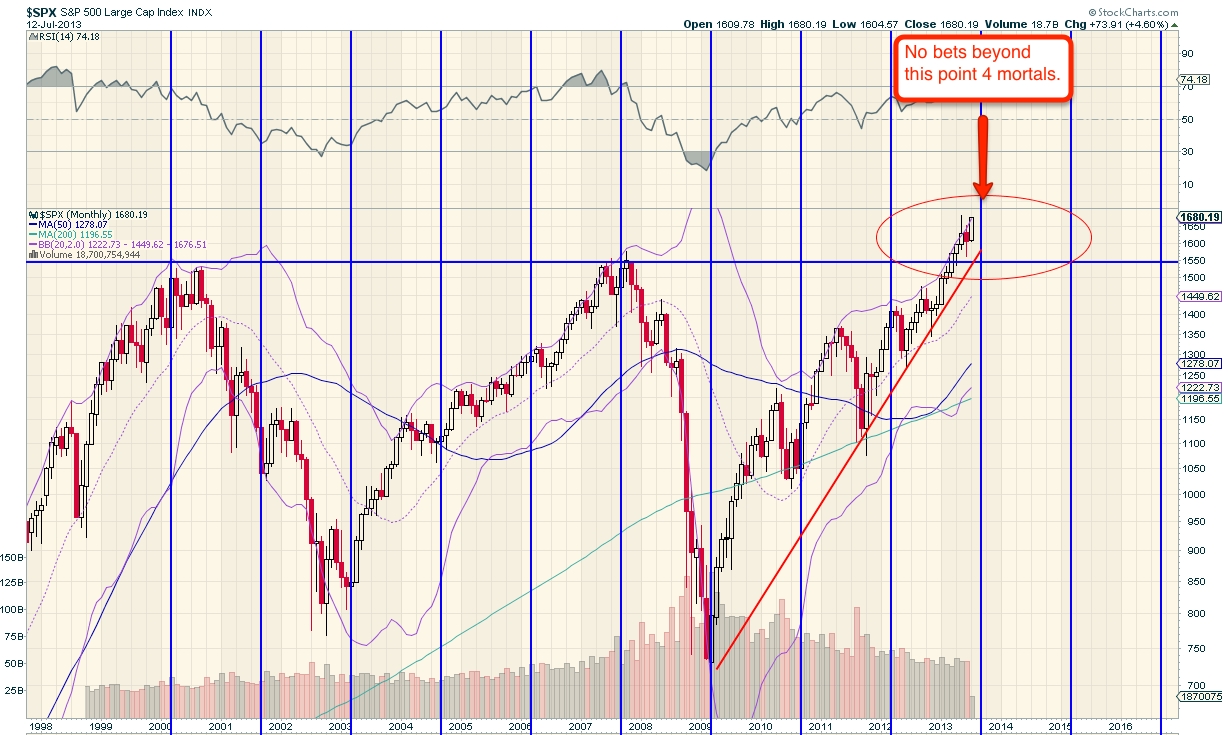 SPX: The SPX closed the week at 1680.19 just short of the previous top of 1687. With that, SPX kept its promise of wave counts that showed there would be another rally after the last fall with the possibility of a new high. I repeat what I have been saying for Nasdaq. In terms of wave counts, we have run out of telomeres. To get an extension you would need a new high five to six pc higher than the previous top such that the next correction down doesn't go lower than 1560. That's a tall order so late into a mature rally. So the prudent would take their money and run. Don't play the short game though. Not yet. Best to wait for confirmation of an intermediate down-trend.
 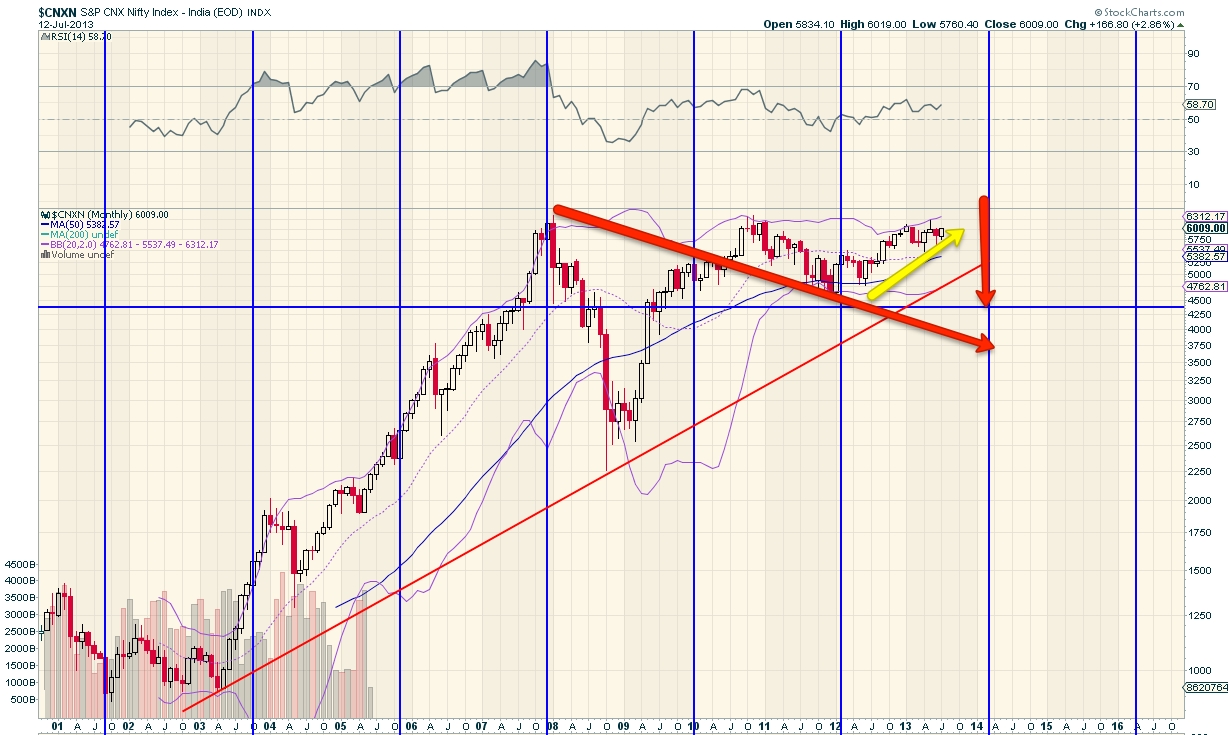 NSE NIFTY: By one count, but not the one I favour [both show a similar prognosis but this one is easier to explain], suggests Nifty is approaching the end of its correction from the 2008 top. Curiously, the market might hit the bottom just as the election results for 2014 come due. Coincidence? No, the trick's been accomplished by an extension to the bearish wave count. Meanwhile, the old prognosis stands. Nifty is headed up into a counter-trend rally that can see it make a new high in the region of 6300.