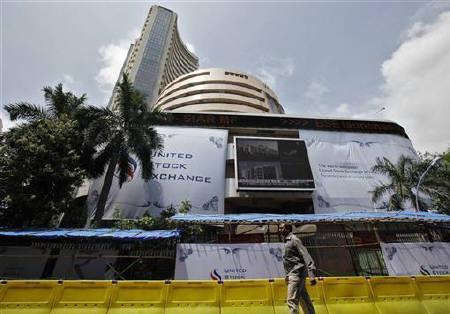
The markets saw a trend reversal towards the end of the week, owing to disappointment on the earnings of select index heavyweights like State Bank of India and Tata Steel. The BSE benchmark index rallied to a high of 18,973 in mid-week trade, rising about 220 points from the previous week's close. The index, however, slipped to a low of 18,656, ending the week with a loss of 72 points at 18,684.
Among Sensex stocks, Cipla and Tata Motors surged about four per cent each to Rs 393 and Rs 281, respectively. HDFC rallied three per cent to Rs 790. ITC, Wipro, BHEL and HDFC Bank were the other major gainers. Tata Power fell five per cent to Rs 101. Hindalco fell about four per cent to Rs 113, while ONGC, Larsen & Toubro and Tata Steel fell about three per cent each.
The Sensex seems to have retracted from the higher end of the monthly Fibonacci level stated last week (18,970). Now, the bias is likely to remain bearish, as long as the index sustains at below 18,790-levels. On the downside, the index may seek support at 18,500-odd levels. Failure to sustain at about 18,500-odd levels could trigger a fresh sell-off, with downside targets of 18,220-18,050-odd levels.
The NSE Nifty moved in a tight range of 100 points. From a high of 5,777, the index dropped to a low of 5,677, finally settling with a marginal loss of 11 points at 5,686. The Nifty faced resistance at the higher end of the Bollinger Band on the daily charts, before retracting to settle at about the 20-day daily moving average of 5,685-odd levels.
The short-term bias has turned bearish, with negative divergence seen on the 14-day RSI (Relative Strength Index) and the daily Stochastic Slow. The index is likely to face immediate resistance at 5,750-odd levels. On the downside, sustained trade at below-5,680 levels would see the index slip to 5,600-odd levels.
According to the weekly charts, the moving average convergence/divergence is in favour of the bulls, while the Stochastic Slow is in a negative mode. The RSI indicates consolidation. It seems the Nifty may consolidate in a broad range of 5,600-5,750; a break and closure below 5,600 would be termed a fresh bearish sign.
The overall weekly charts continue to remain positive for the Nifty, as the index is comfortably placed above its moving averages. In the worst-case scenario, the index may plunge to 5,450-odd levels, the 20-week moving average. On the upside, the monthly charts indicate a target of 5,925-odd levels.