 India Inc scored heavily on revenues during the 10 years of the United Progressive Alliance regime but profitability took quite a few hard knocks.
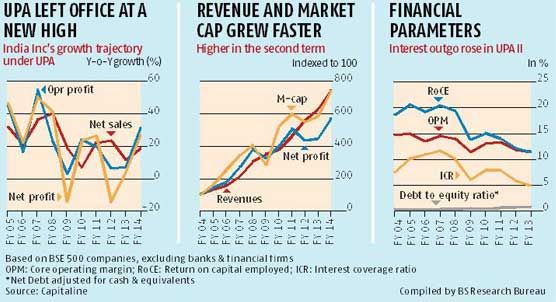
The combined revenues for BSE 500 companies, excluding banking and finance, jumped by nearly seven and a half times between 2003-04 and 2013-14, growing at a compound annual growth rate of 22.2 per cent.
Including bank and financial firms, the revenue growth was 21 per cent (see chart).
But what India Inc lacked were profits.
Net profit expanded at a CAGR of 19 per cent during the period as expenses, especially employee costs and interest payments, grew faster than revenues.
India Inc’s salary bill grew at a CAGR of 23.6 per cent in the last 10 years, while interest payment expanded at the rate of 19 per cent.
Profit growth is likely to decline further as many debt-laden companies in sectors such as metals, energy, construction and infrastructure and automobiles are yet to declare their results for 2013-14.
In the first nine years ending 2012-13, interest payments for non-financial BSE 500 companies grew at a CAGR of 23 per cent, faster than the 21.1 per cent growth in revenues and the 14.4 per cent growth in net profits during the period.
At 28.4 per cent, revenue growth during United Progressive Alliance I was much higher than during United Progressive Alliance II (16.2 per cent).
Net profit growth more than halved to 11.8 per cent in the second half of the UPA regime from a high of 26.6 per cent in its first term.
In contrast, interest payments grew much faster under UPA II (20.5 per cent) than UPA I(17.4 per cent).
The analysis is based on 156 non-financials and 54 banks and financial firms that have declared results for 2013-14.
Contrary to perception, the revenue growth was across the board. Infotech exporters led by Tata Consultancy Services topped, growing at a CAGR of 30 per cent during nine years ending 2012-13, followed by real estate (27 per cent), automobiles (25.4 per cent), construction and infrastructure (25.3 per cent) and telecom (25 per cent).
 Power generation firms were laggards, growing at a CAGR of 17.8 per cent.
Pharmaceuticals and agrochemicals, where India has developed a competitive advantage, grew at a CAGR of 18.2 per cent during the period.
The rest of the manufacturing sector, including textiles, metals, capital goods, fertiliser and chemicals, and cement grew faster at a CAGR of 21.5 per cent.
Sectoral numbers are for the year ending March 2013, the latest year for which the full finances, including the balance sheet, are available for all BSE 500 companies.
Many companies in sectors such as infotech, pharmaceuticals,
consumer durables, automobiles, cement and consumer goods used the growth to transform themselves radically.
But for others, faster growth became a winner’s curse, resulting in over-leveraged balance sheets and poor profitability during UPA II that coincided with an economic downturn in India and abroad.
“Many companies mismanaged growth and over-leveraged their balance sheets in the boom years.
“This landed them in a financial soup when demand growth and profitability came under pressure after the 2008 financial crisis,” says Deep Narayan Mukherjee, director, ratings, at India Ratings.
The trend was most visible in the construction and infrastructure sector.
The combined net debt (adjusted for cash and equivalents) for construction and infrastructure companies grew at a CAGR of 45.5 per cent and interest payment grew at 36.7 per cent during the period.
It resulted in a nearly 30-fold rise in their combined net debt during the period.
In comparison, their revenues grew at a CAGR of 25.3 per cent, while operating profit grew at a CAGR of 30.4 per cent during the period.
For example, GMR Infra’s revenue grew at a CAGR of 63.4 per cent and jumped around 100 times to Rs 11,500 crore (Rs 115 billion) in 2012-13 from Rs 136 crore (Rs 1.36 billion) in 2003-04.
Profitability lagged, with operating profit growing at CAGR of 49 per cent while net profit growth expanded at a CAGR of only five per cent during the period.
A similar gap between top and bottom lines’ growth is visible in JP Associates, Videocon Industries, GVK Power & Infra, Aban Offshore, Shree Renuka Sugars, Suzlon Energy and Alok Industries, among others.
Companies such as Tata Steel, Hindalco, Bharti Airtel, Indian Hotels, Shree Renuka Sugars and Tata Chemicals added to their woes by going for multi-billion-dollar acquisitions abroad at the height of the boom.
While these provided them with global scale, it hobbled them with debt and poor profitability when the recession hit North America and Europe in 2008.
The market value of these debt-laden firms declined to a fraction of the debt of their balance sheets, pushing them into a downward spiral of high indebtedness, poor profitability and low valuation. There has been a sharp uptick in the market capitalisation of many of these firms in recent weeks, which has raised hopes of a turnaround if companies use the rally to raise fresh capital at good terms.
In contrast, firms that were mindful of their balance sheets and cautious in their expansion plans in the boom years are sitting pretty.
Nearly a third of the non-financial BSE 500 companies were debt free at the end of 2012-13 and another third have market capitalisation that is more than twice their net debt at end of 2012-13.
In other words, nearly two-thirds of India Inc is far from any financial stress and is ready to take advantage of new growth opportunities.

 India Inc scored heavily on revenues during the 10 years of the United Progressive Alliance regime but profitability took quite a few hard knocks.
 Power generation firms were laggards, growing at a CAGR of 17.8 per cent.