Time to take profits and move to the sidelines in an euphoria, says Sonali Ranade
This should really be seen as a continuation of last week's report. That showed the long-term state of the markets in monthly charts and demonstrated how we were nearing an inflection point in the context of long-term trends. I would encourage you to read it for perspective. This report deals with the same impending inflection point -- the possible onset of an intermediate correction -- from the perspective of the last leg of the rally-up in terms of daily charts. The message from both in more or less the same.
Russell 2000, Nasdaq and S&P500, together with EU equity markets such as the DAX, show they are in the last part of this leg of the rally that started in November 2012, a point that marked the end of wave IV for most US markets on the way up from March 2009. What that means is we will have a correction around mid-August for sure. The only issue is if it will be like the ones we have seen many times on the the way up here or will it be of a much longer -- and deeper -- duration in terms of time and distance covered?
The maturity of the bull markets in terms of time, and the wave counts, favour the odds of a longer and deeper intermediate correction. Note, that doesn’t mean a crash like the one we had in 2008. In fact the principle of alternation almost guarantees that the next correction will be beguilingly gentle to begin with. The sting and value destruction will be in the tail. What we are likely to see is a gradual deepening of the drops in prices followed by rallies that recover only part of the ground.
The price correction in most commodity markets is more or less over. That doesn't mean they are now bullish. But many will tank with the correction in equity markets and that might be a good time to accumulate some of them for decent tradable intermediate counter-trend rallies. I have new take on WTI crude that might interest traders. It shows crude peaking out at $115 and then joining the rest of the herd into a correction.
The DXY can correct down to 81.25 in the wave IV correction now underway. I reckon we are in the C leg of it. But maintain my long-term view of the dollar heading towards 85.50 or higher by the year-end. That has implications for INR in Indian markets.
Time to take profits and move to the sidelines in an euphoria. The Russell 2000 mid-cap space is unbelievable. It has just returned 11 pc in the last 18 days over and above a similar leg just prior to the last correction. If that's not euphoria, what is?
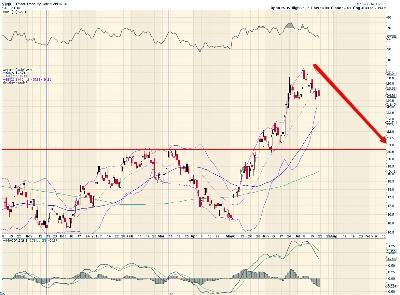 Yield on 10-Year Treasury Notes [$TNX]:
As expected, the yields on 10-year Treasury Notes [$TNX] drifted down during the week as panic in the bond markets subsided. They closed the week at 249.10 basis points. Note, this doesn't alter the fact that the interest rate cycle has turned up decisively. Nor has all of Fed's talk been able to reverse this fact.
Yields can be expected to drift down towards the 205 basis points mark as the market tests new support for the yields. The drift down simply accepts the new higher normal yields while working off the excesses of the panic.
If, as expected, the equity markets do begin an intermediate correction in mid-August, we could see a lot money returning to US treasuries, further depressing yields. So the panic in bond markets is definitely done and over.
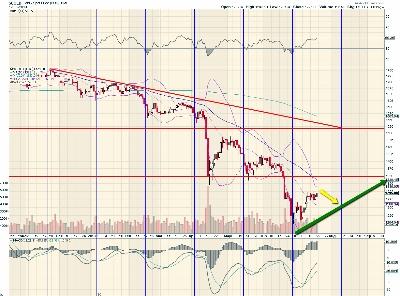 Gold:
Gold:
Gold closed the week at $1292.90 after having made a bottom at $1223.70. I would not think we have found a long-term bottom in gold as yet. There may be further declines to come in the months ahead. But for now we have a temporary bottom at 1223.70 and gold appears to be rallying to establish some sort of an upper range within which to consolidate in the weeks ahead.
Gold could rally to 1350 or so till the middle of August in line with other risk assets. The metal could then correct to retest $1223.70 before attempting further counter-trend rallies.
Gold's 50 DMA lies at $1350 and it could act as the first major overhead resistance. Not bullish on the metal despite the counter-trend rally underway. The metal could correct sharply as other risk assets fall in the ensuing across-the-board correction that I anticipate mid-August.
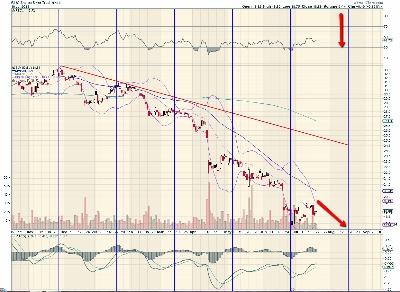 Silver:
Silver closed the week at $19.46 after having made a high of $20.25 since the bottom at $18.17. I remain very sceptical about the metal. My wave counts indicate that the metal could seek lower lows after mid-August. The metal has no notable price support before $14 on the downside. These aren't levels to play the short side. But until silver finds a confirmed bottom, avoid trading in the metal long or short.
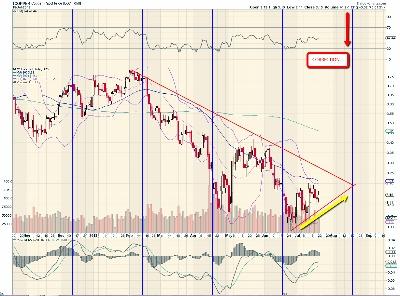 HG Copper:
HG Copper went into a small counter-trend rally after finding a temporary bottom at 2.9835 on June 25. The metal closed at 3.14, just under its 50 DMA, which is at 3.21. Copper's counter-trend rally is unlikely to go beyond 3.21 for now.
Copper will correct with the rest of the markets. But there isn't much downside to the metal below 3.0 and it could see a ferocious bear squeeze over the next few months if not weeks. Again, the metal is at the fag end of a very long correction and unless you are a compulsive trader, it is best avoided for its unpredictable volatility.
Not yet time to accumulate for the longterm.
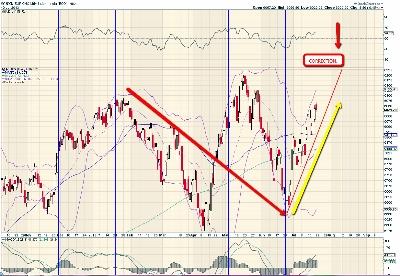
 WTI Crude:
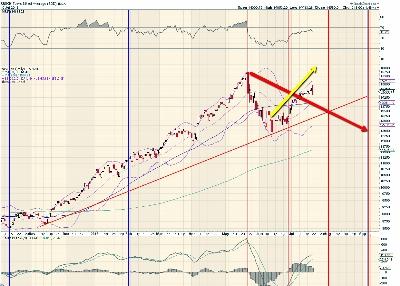
WTI Crude's counter-trend rally has been baffling to many in many ways. The best way to get your arms around the big technical picture is shown in the above chart.
Crude made a top at $107.43 in April 2011 and then corrected to $79.76 in June 2012. The rally from June 2012 now underway can take crude to as high as $115. See together with the rally in crude from the low of $40.24 in January 2009, you get a picture perfect 5 wave impulse rally that terminates mid-August around $115.
Must admit, it took me a long long time to figure out this one. But it neatly accounts for the twists and turns in the crude prices that we have seen since 2009. If my analysis confirms a top of $115 in mid-August, we have fairly long correction in crude prices ahead of us.
 US Dollar [DXY]:
The dollar has been correcting from its recent top at 84.9250 made on July 9. The correction, a 3-part A-B-C, Wave 4 could take DXY down to as much as 81.25. We are in the C part of the wave. The dollar is likely to resume its uptrend on a successful test of 81.25.
The low on DXY corresponds to the expected high on the equity markets around mid-August. Coincidence? If so, very convenient!
Maintain my long-term bullish view on the DXY with a target of 85.50 before the end of this year.
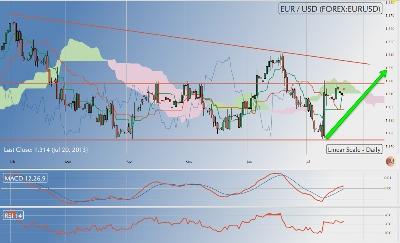 EURUSD:
The EurUsd has completed its complex correction from the top of 1.37 with the close at 1.2780 on July 9. With that the currency pair resumes its counter-trend rally underway from the low of 1.2050 formed in August 2012.
EurUsd closed the week at 1.3142, well above both its 200 and 50 DMAs both of which are fairly close together at 1.31 though they haven't generated a long-term buy signal as yet.
EurUsd's first major overhead resistance lies at 1.34 while the 200 DMA will be its first support for some time. Mind, this is a counter-trend rally and so subject to a very high degree of jaggedness and volatility.
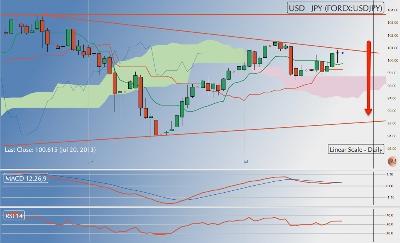 USDJPY:
The UsdJpy has been in a counter-trend rally from the low of 94 made on June 14. The rally appears to have topped out at 101.17. The pair is now into wave C of the correction from the recent top of 103.65 with a target of 94.
That said, has the counter-trend rally ended at 101.56 as the chart shows? Not quite. There is room on the charts for the counter-trend rally to extend all the way to 103.50. On the other hand, as a read of DXY indicates, the extension is possible but improbable.
The EurUsd may be the better way to play the DXY for the immediate future till the USD has definitely topped out in the yen market.
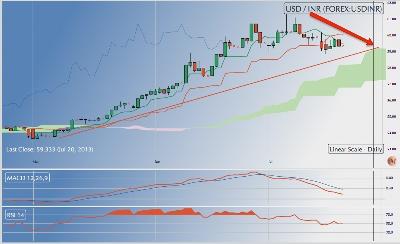 USDINR:
The dollar appears to be consolidating just above the INR 59 mark on the charts. This consolidation is likely to continue well into September before the dollar makes any major move either way.
The dollar's first support in the consolidation lies at INR 57.30 followed by another major support at INR 56. As DXY heads lower to 81.25 from its current level at 82.71 over the next few weeks, expect it move lower in the INR market to test both these support levels.
The panic in the INR market should now be over. Note, the fall in DXY is not yet fully into the UsdInr price at the moment because of the panic buying.
That said, maintain my bullish view on DXY and UsdInr. We may end the year with UsdInr closer to INR 63.50 levels rather than INR 56.
 NIKKEI 225:
The Nikkei 225 closed the week with a key reversal day at 14,589.91. The index is in a counter-trend rally from the low of 12,435.95 with a target of 16000 or thereabouts. Nikkei has many a key reversal day and the rally just continues as if nothing has happened. So it is no more than a cautionary flag at this point.
My sense is that Nikkei will at least make a higher top than the one at 15,962.89 in this counter-trend rally. The wave counts for Nikkei that I favour show the rally from the low of 6840 in October 2009 as the Wave I of a new bull market, which though poorly structured, hasn't yet quite finished its job and has much distance and time to go. The leg down from 15,962 was "A" part of the correction and we are in "B" up. It is usual for B waves in Wave I to exceed the leg down in distance. For Nikkei to confirm that pattern would be a very powerful bullish signal. Maintain my bullish stance on Nikkei for a new top. The correction from there will likely coincide with the mid-August D-day.
 Shanghai Comp:
Shanghai made a recent low of 1851 and rallied smartly from there to make a high of 2093, just under it 50 and 200 DMAs. The index closed the week at 1992.65 and is in the process of correcting for the last rally.
My sense is the SSEC could drift down to 1900 early next week and that would be a good buying opportunity if it comes by. That said, Shanghai is likely to turn up from 1900 or perhaps even earlier to rally for at least its 200 DMA which is currently in the 2200 region.
The peak is indicated at the middle of August. The index could well correct from there along with rest of the world markets.
 German DAX:
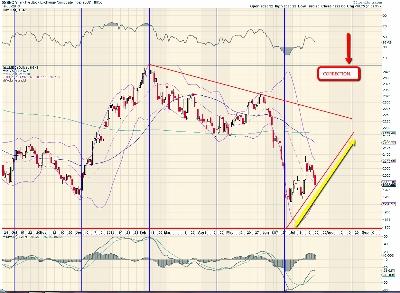
There are only two issues in all the charts that follow. Firstly, will there be a new high? And secondly, will the new high be high enough so that the correction that follows won’t tip the index into an intermediate correction?
First, there is space for a new high. There is nothing on the charts, not even over-bought conditions, to show that there won't be one. Will it be high enough? My sense is DAX would have to overshoot its indicated target by a good five to eight pc for it to avoid a follow-on intermediate correction. The wave-counts say it is good place to trigger an intermediate correction. The rest really depends on the exact technical state of the market.
The correction that follows will be deceptive and back-ended, and not a crash.
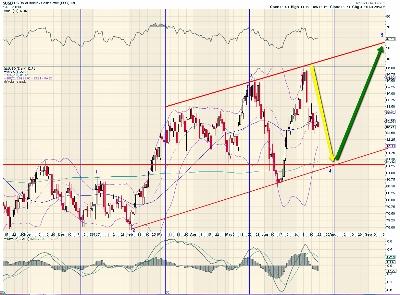
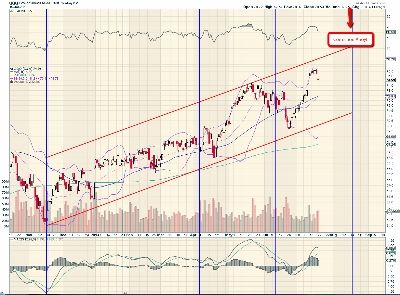
 Russell 2000 [RUT]:
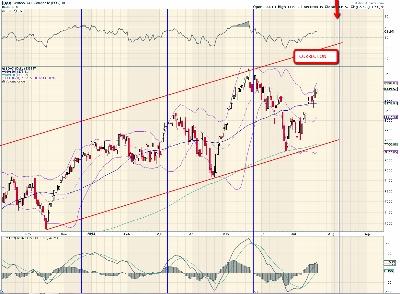
The RUT is arguably the most aggressively bullish index in the US and that by itself should be a cause for concern! It is the buying frenzy in mid-cap stocks by retail investors that sets up markets for deep corrections. Plenty of evidence that a buy frenzy is actually underway.
The RUT closed the week at 1050.48. From the last low of 943.41, Russell is already up by 107.07 points or 11.3 pc in a little over 18 days. This is on the top of another similar parabolic run from 898 to 1010 about a month back. How much can the herd digest?
The RUT has already made a new high. There is room for some more euphoric rise. It would be foolhardy not to take profits and run. Such euphoric conditions signify serious longterm distribution to the gullible and greedy.
 Nasdaq 100 or $QQQ:
Instead of the Nasdaq 100, I have used its equivalent $QQQ ETF that has the advantage of an explicit volume to go with the price and is often more revealing than the Index itself.
The $QQQ has rallied sharply from its low of 68.99 to a high of 75.50 before closing the week at 74.59 following appalling results from MSFT and GOOG. The index has major support just atop the gap at 74 that it had better not fill. In fact, that might be a good way to trigger your stop losses and exit the market.
The index is likely to test its support at 74 before continuing into the rally. As I indicated last week, the rally has run out of telomeres. You could have an extension if the index pulls a spectacular five to eight pc rally from current levels. But the probability is dim and the odds are that the next correction will gently tip the markets into an intermediate term correction spanning many months.
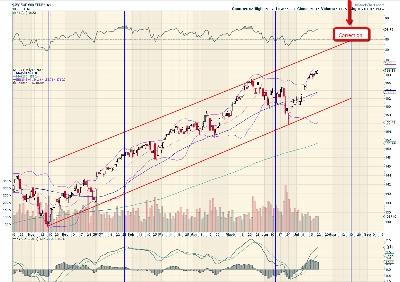 S&P 500 using SPY:
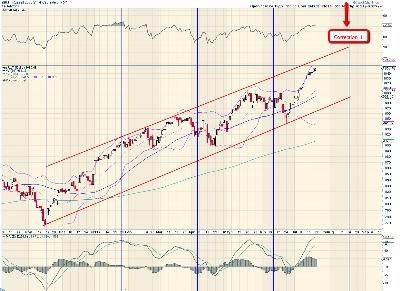
The SPY is just a traded ETF version of the SPX. The advantage of using it instead of the index is a good handle on volume versus price equation.
The SPY has already made a new high. The question now is about the correction to follow. Will it be a modest one-shot affair spanning a few weeks or a month or two to be followed by a resumption of the bull market, or will it be one spanning a year or more?
The SPY is barely 1.50 points higher than the top of the previous rally that triggered a correction. Namely it has made a high of 75.50 against the previous top of 74. That is not much. What the numbers signify is diminishing strength in momentum. The SPY has scope to go higher. But it would be wise to take profits.
Volumes in both QQQ and SPY have been higher on days the market declined. There are divergences on the RSI charts as well. All said, odds favour the onset of a fairly prolonged correction at the end of this leg of the rally. D-Day could be any day after August 14 though my charts suggest 19th for SPY.
 NSE NIFTY:
The Nifty closed the week at 6029.20 after rallying from its recent low of 5590, also its 200 DMA. The rally towards the previous top of 6250 is reactive in nature. Emerging markets have been correcting savagely for some months now and may not take a severe hit as the world markets tip into an intermediate correction. But it would be unwise to rule out turbulence.
My sense is Nifty will almost certainly hit a higher high than 6250 in this rally. It is the correction that follows which will be crucial. I would take profits at the projected high and then see how the correction that follows shapes up.
It is hard to see a meaningful and sustainable rally in the Nifty before a new government steps in. And as the long-term charts in the previous reportshow, there is room for a downturn in Nifty that takes to test 5400 or even lower by the end of 2013.
Wise to take profits.
NB: These notes are just personal musings on the world market trends as a sort of reminder to me on what I thought of them at a particular point in time. They are not predictions and no one should rely on them for any investment decisions.
Sonali Ranade is a trader in the international markets

 Yield on 10-Year Treasury Notes [$TNX]:
 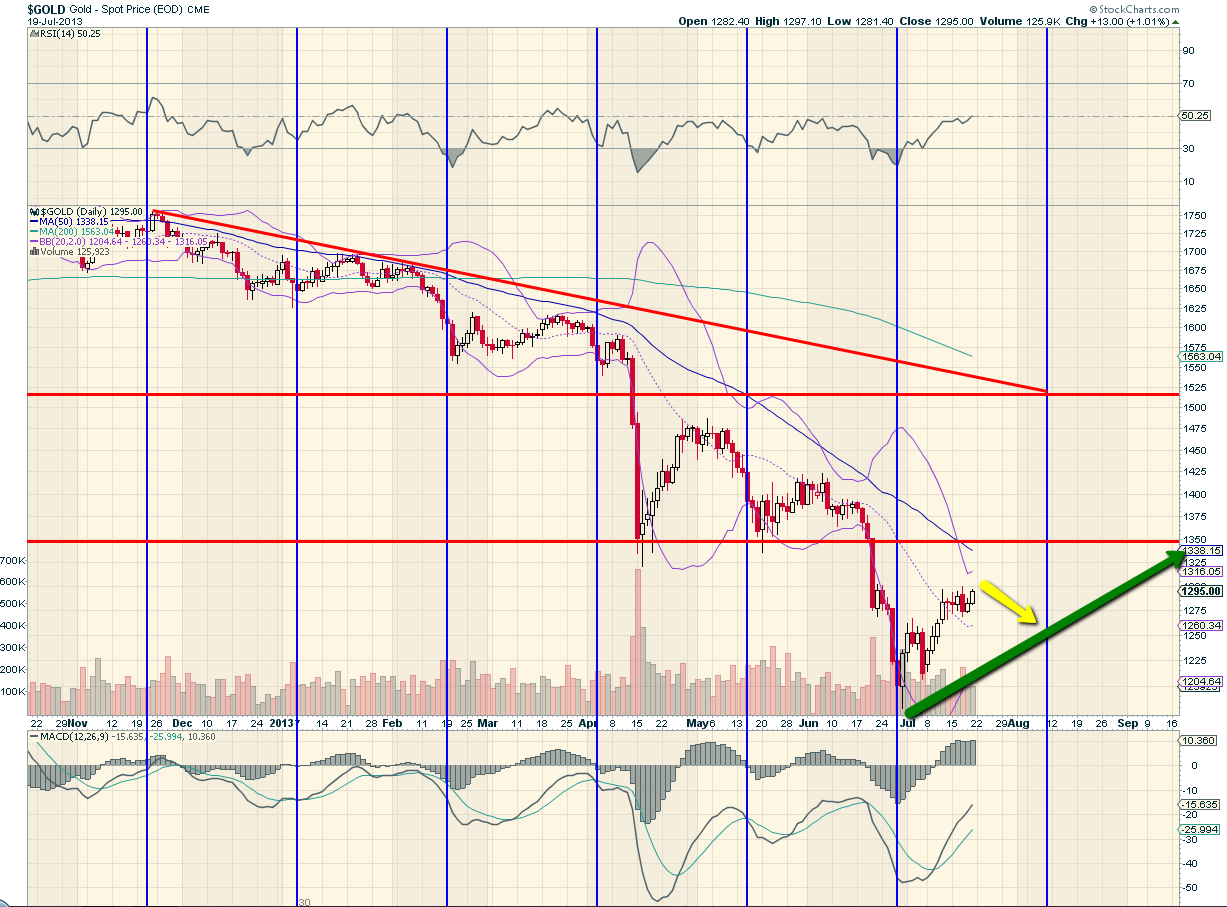 Gold:
Gold: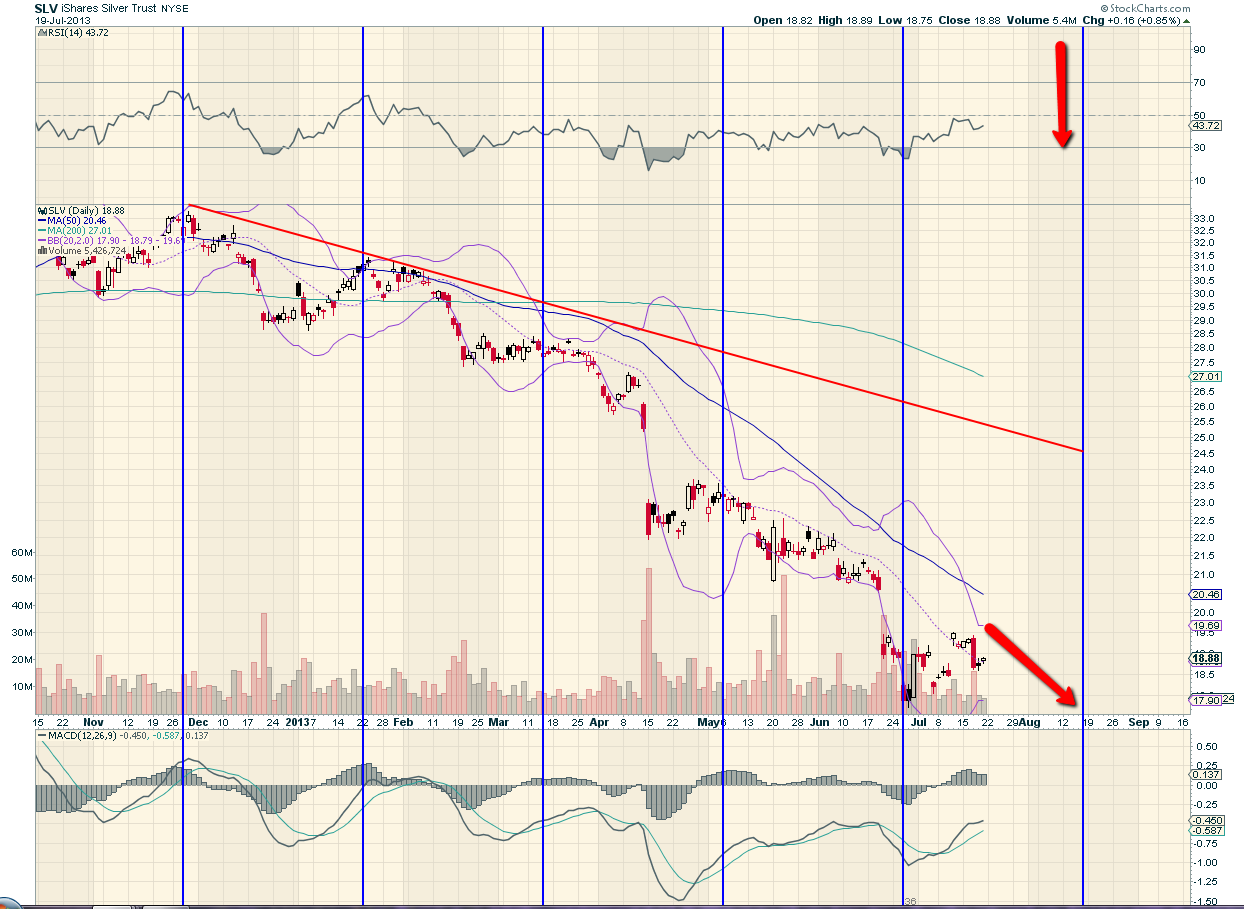 Silver:
 HG Copper:
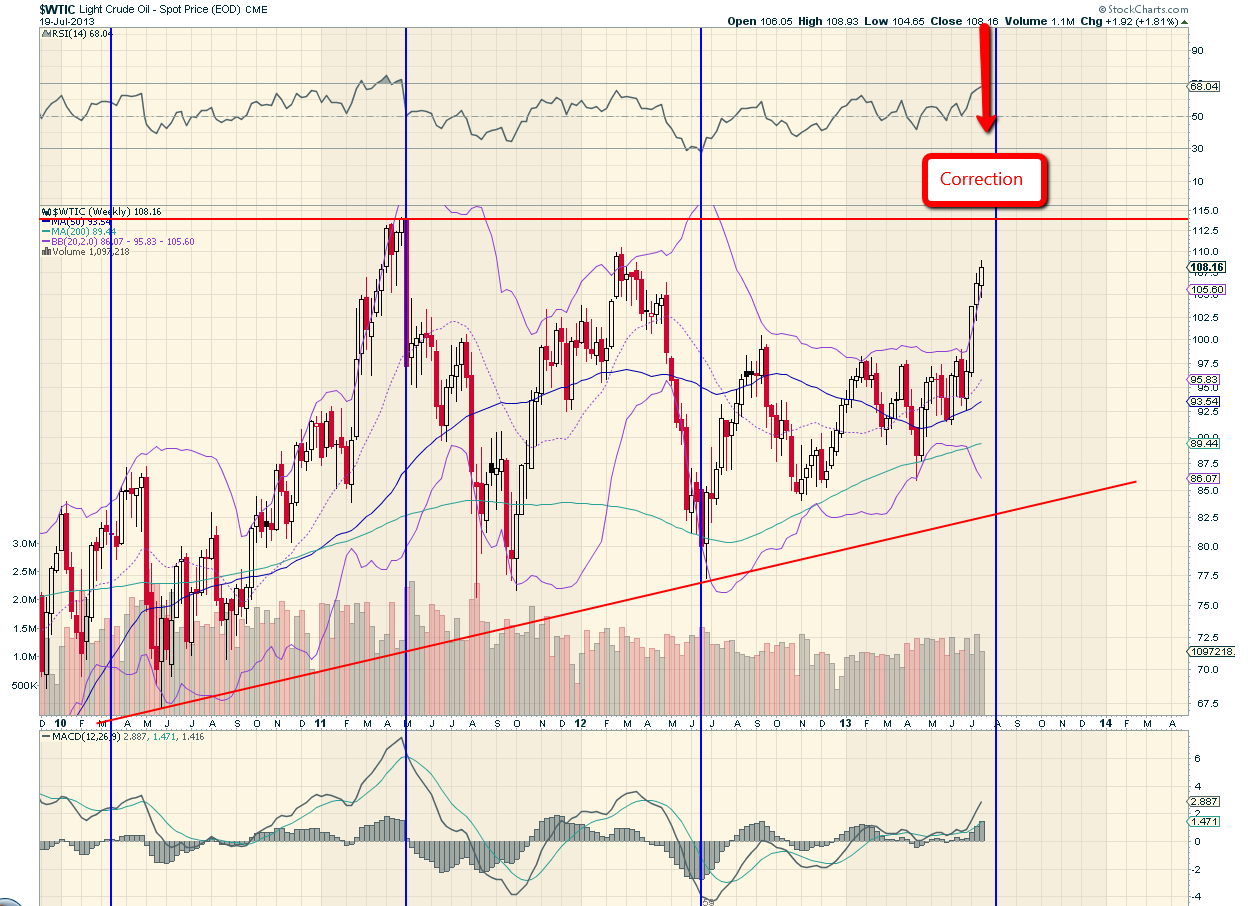 WTI Crude:
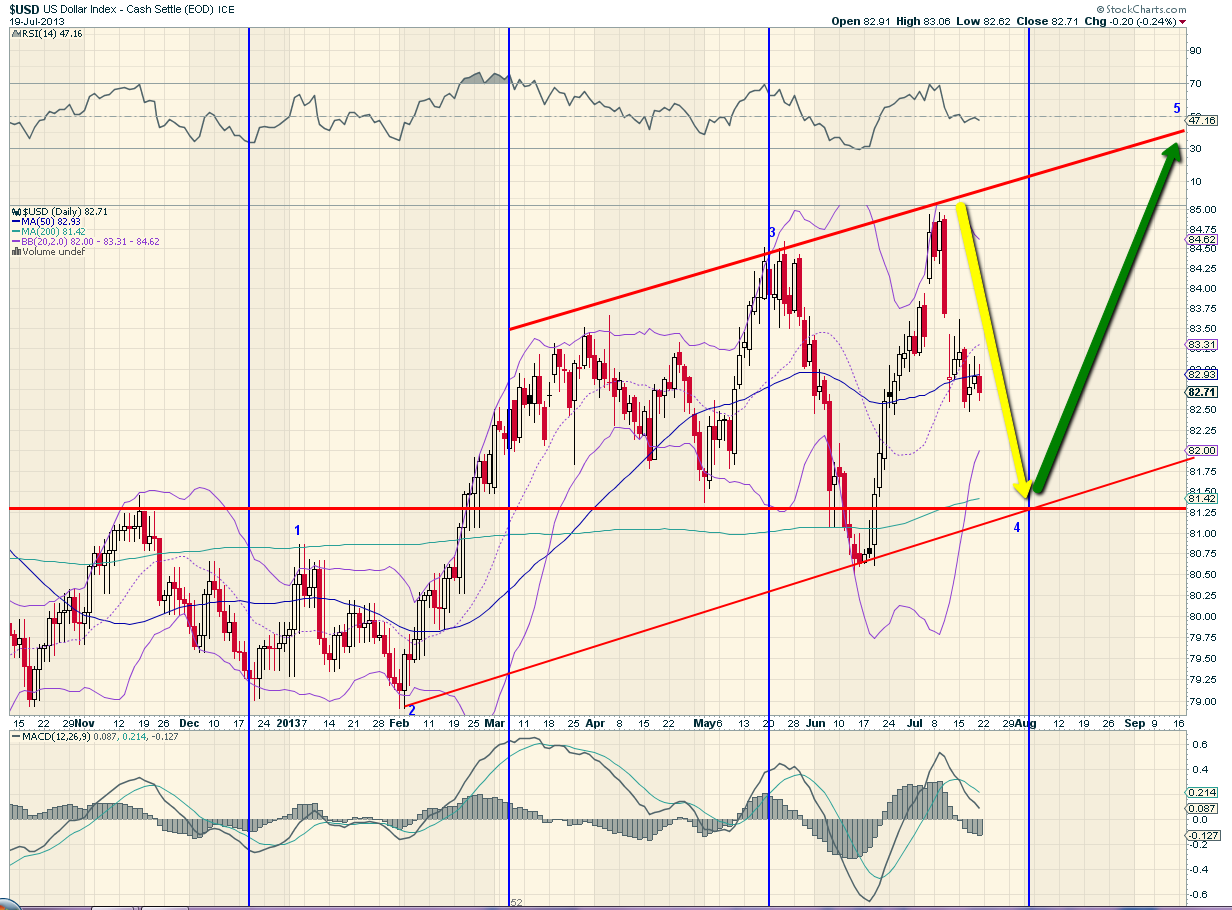 US Dollar [DXY]:
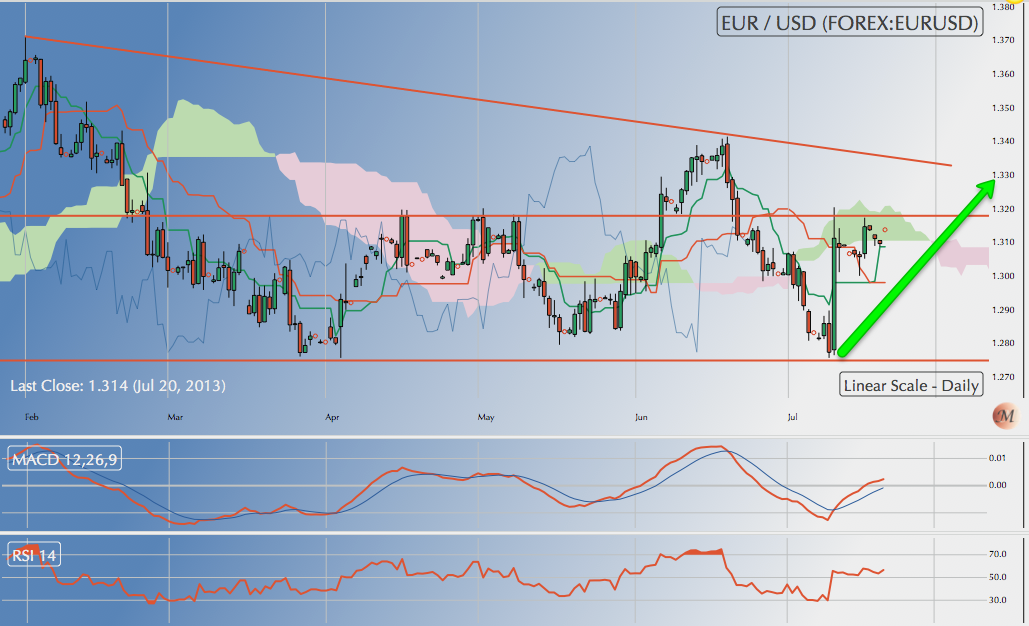 EURUSD:
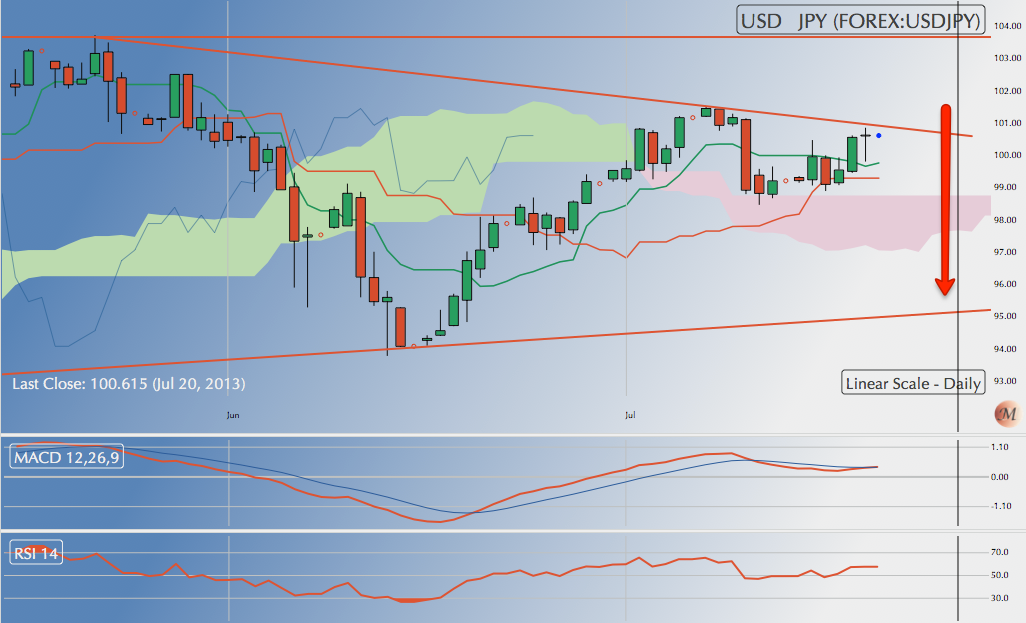 USDJPY:
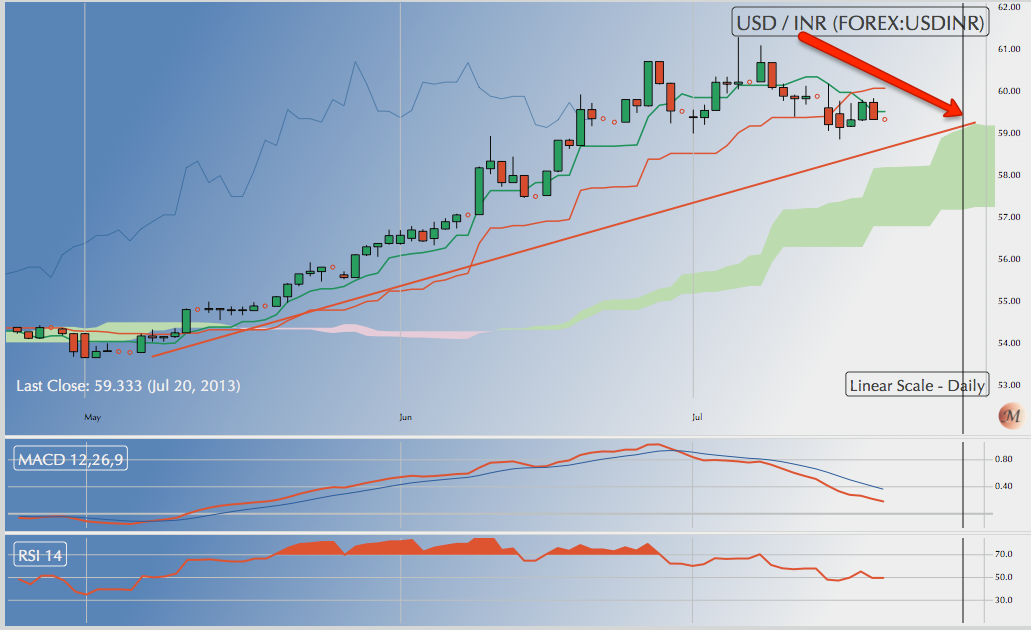 USDINR:
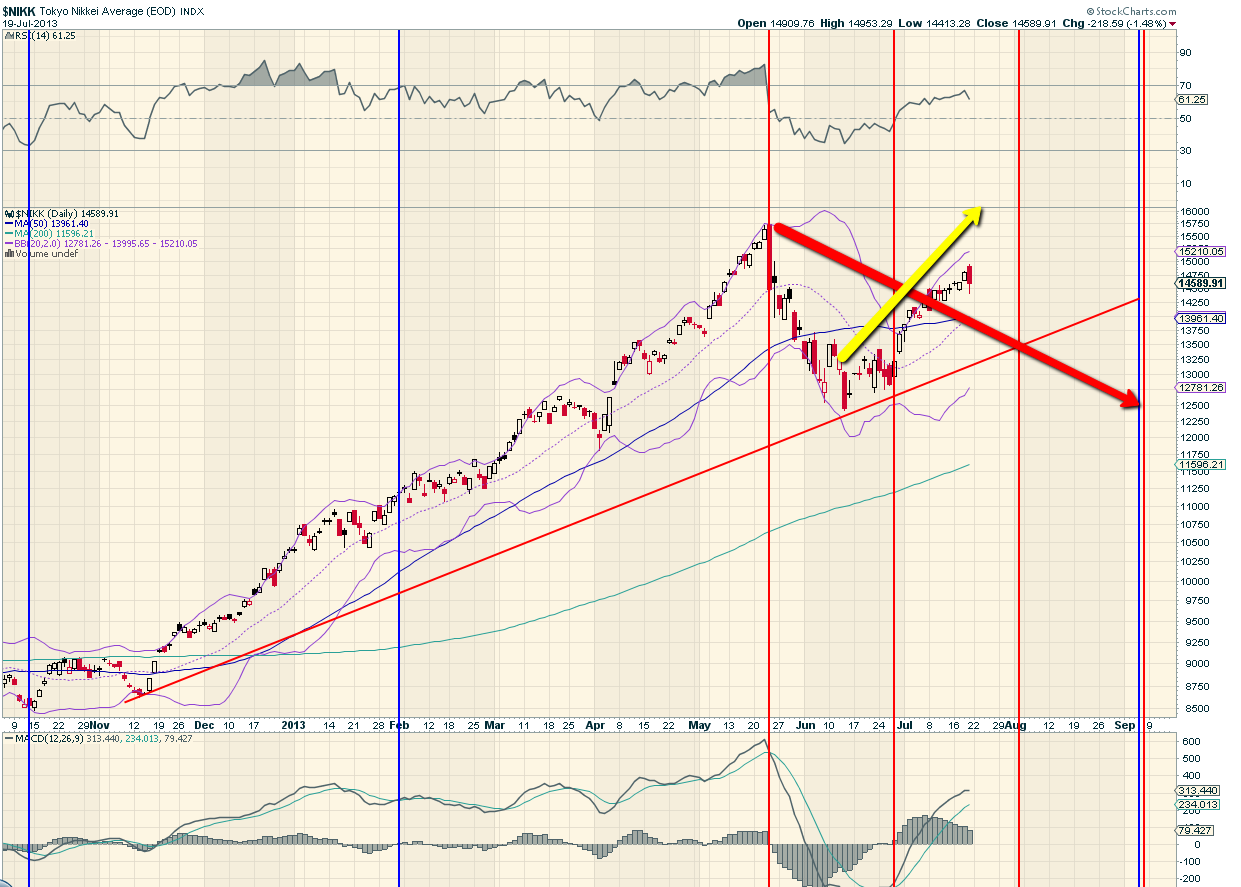 NIKKEI 225:
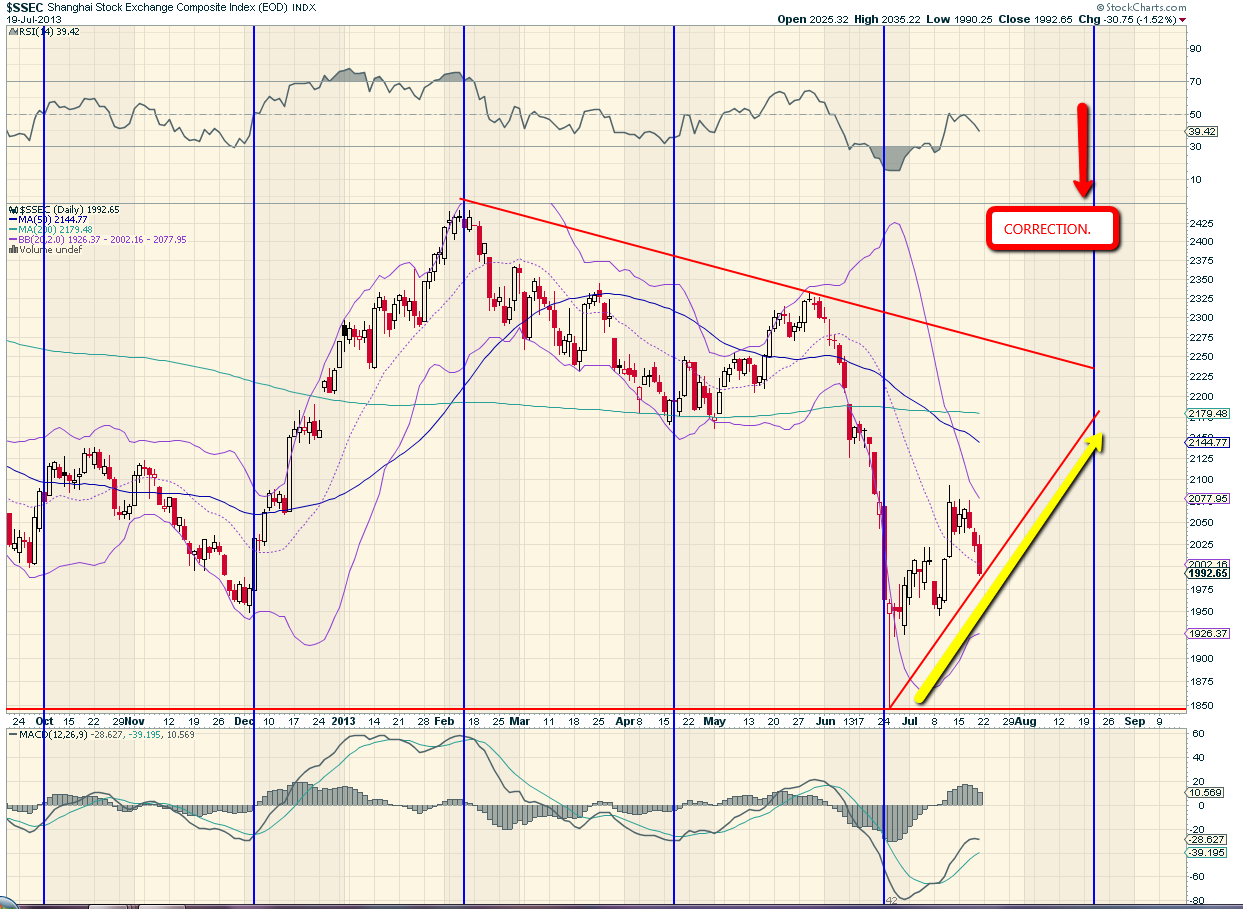 Shanghai Comp:
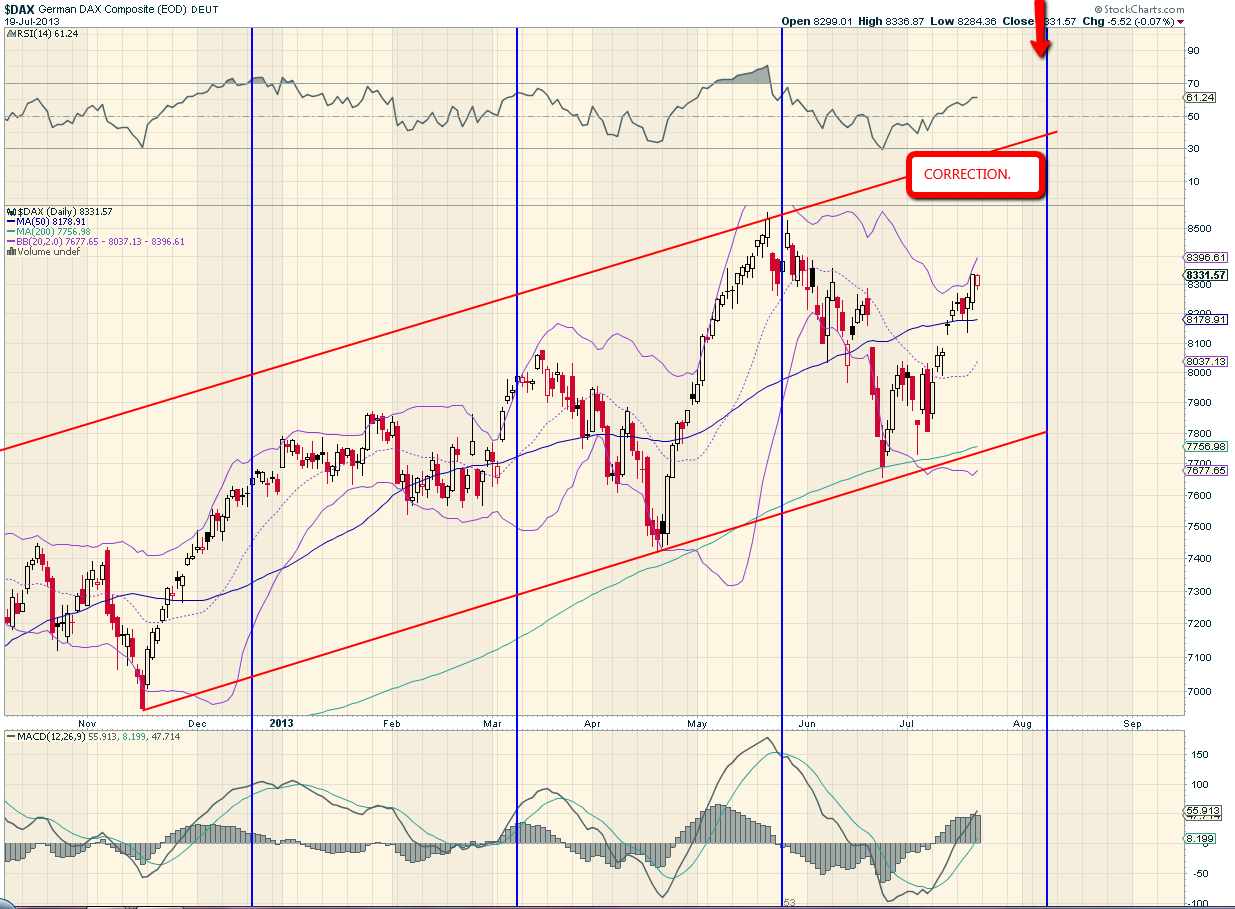 German DAX:
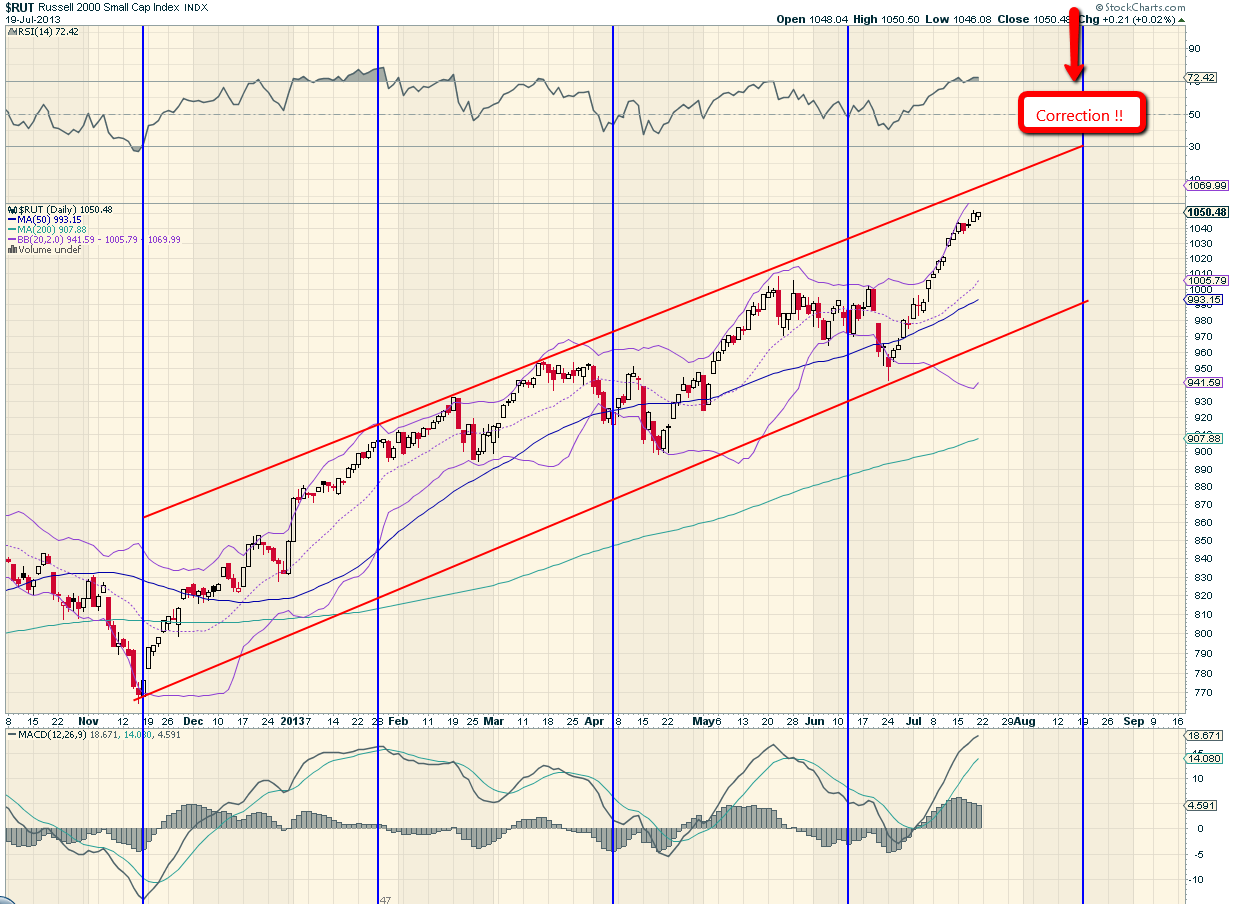 Russell 2000 [RUT]:
 Nasdaq 100 or $QQQ:
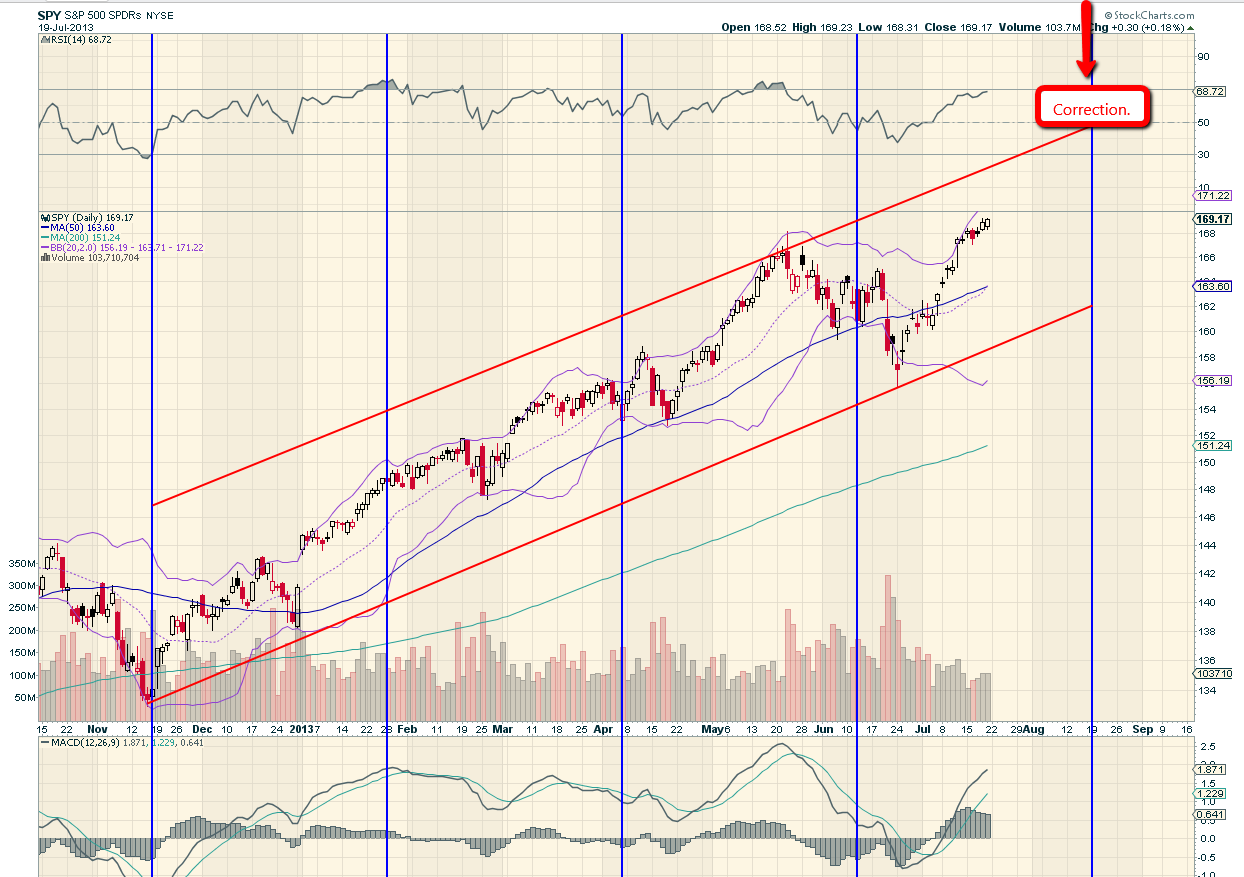 S&P 500 using SPY:
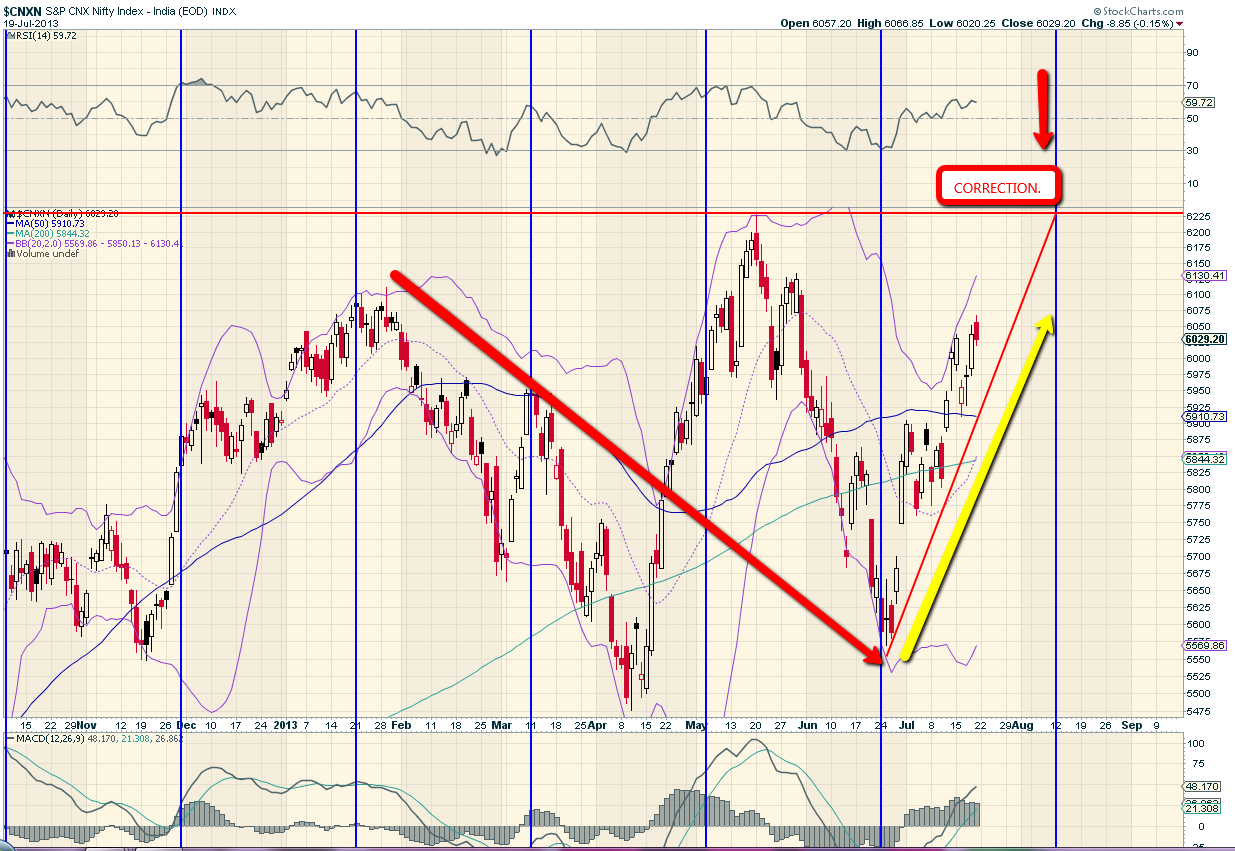 NSE NIFTY: