 | « Back to article | Print this article |
The dollar is king in an intermediate correction, says Sonali Ranade
There was nothing in the markets to challenge the prognosis of last week that indicated that the markets are likely to tip into a long awaited intermediate correction. The price-volume divergence clearly visible on the QQQ and SPY charts here clearly indicate that equity markets are not only going up in price on progressively thinner volumes but also that the volume on down days is higher than on up days. Such divergences usually presage a market top and are indicative of distribution.
The currency markets saw no surprise either. The dollar continued to correct down in an orderly fashion and currencies such as the euro and the yen went up correspondingly. That helped quell the panic in the $-INR market. However, the DXY is unlikely to correct down any further than 80.50 and the long-term rally in DXY is far from over. Expect the DXY rally to resume in the first or second week of August. That will almost certainly pressure the INR in the Indian market.
Commodity markets saw a dead cat bounce from near-term bottoms and are likely to correct in line with other risk assets as equity markets tip into an intermediate correction. At the moment, all appears set for across the board test of risk asset prices versus the dollar in an intermediate correction that begins in the second week of August. It is something fraught with interest and will set the base for the next market cycle.
I would exit all trading position across all asset classes and dive into the US dollar for now. Avoid shorts until a top is confirmed in the DAX followed by the SPY. Incidentally, Nikkei may have already tipped into an intermediate correction unless it rallies to make a new top early next week, an unlikely event.
The dollar is king in an intermediate correction!
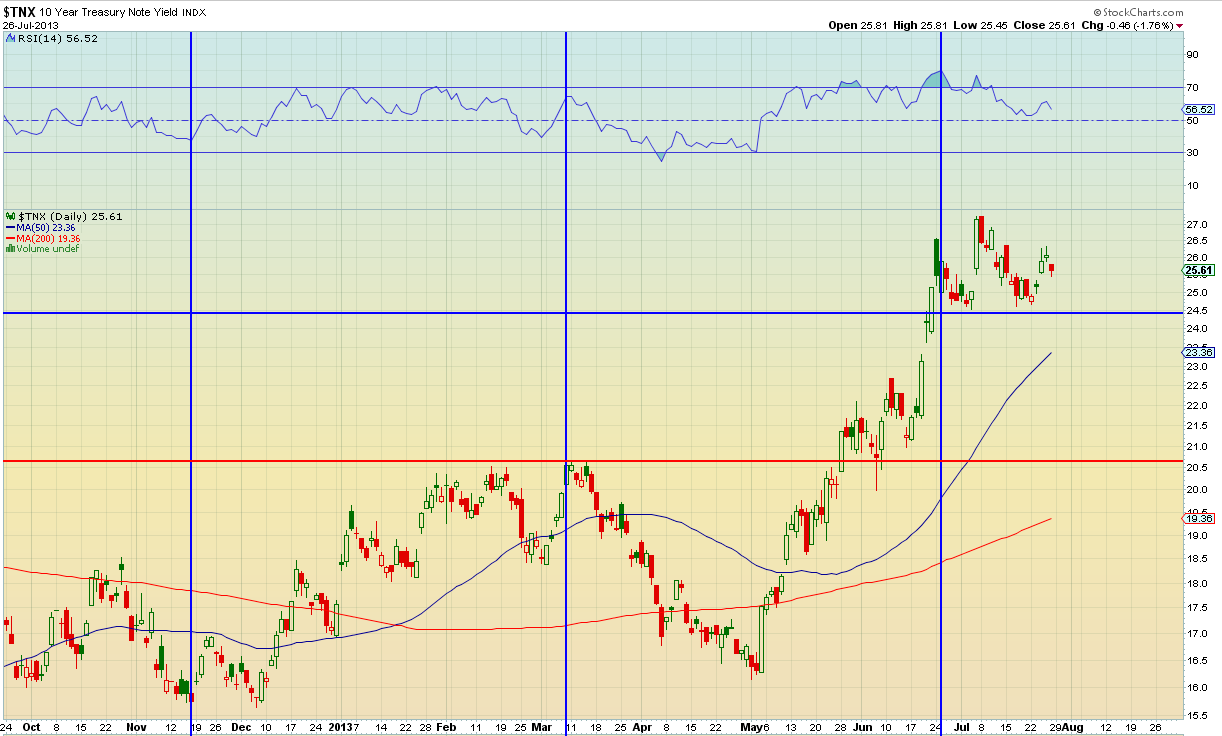 Yield on 10-year Treasury Notes: The yield on 10-year treasury notes continued to consolidate below 270 basis points but above 245 bps. The yields could test the 225 bps level in the coming weeks as the US equity markets go into a correction.
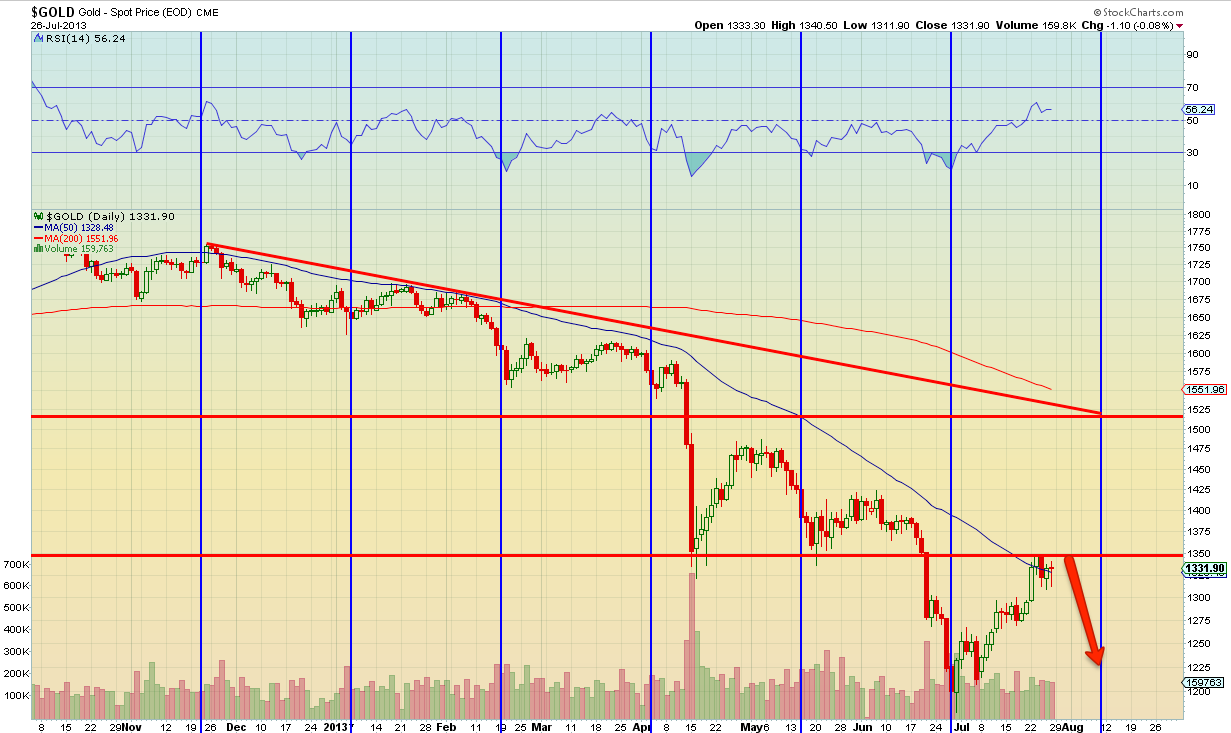 Gold: Gold continued its counter-trend rally and made a high of $1347.21 during the week, pretty much achieving it target for the rally. Gold closed the week at $1321.50, just a touch below its 50 DMA. Gold needs to correct down to the $1200 to $1250 area before rallying further. Over the next week or two, expect gold to retest support in the $1250 area. On a successful test, we could see gold continue its counter-trend rally to $1350 or even beyond to the $1550 area.
 Note, the bottom at $1179.40 hasn’t been retested yet and a further rally is unlikely before that is confirmed as a near-term bottom.
 Silver: Silver closed the week at $19.7710, just a notch below its 50 DMA $20.89. Although silver had rallied from its recent low of $18.17, I am not sanguine that we have seen a near-term bottom in silver. My wave counts show that silver could dive under the $20 level to as low as $14 before finding meaningful support. Continue to be bearish in silver with extreme prejudice
  HG Copper: HG Copper closed the week at 3.1055, well below its 50 DMA at 3.1968. My sense is that the correction on Friday in the metal was just a day or two of correction before the counter-trend rally resumes its march to the 3.40 area on the charts.
That said, I don’t think the full long-term correction in copper is over and the metal would drift lower with other commodities after testing the overhead resistance at 3.40.
 WTI Crude: WTI Crude closed the week at $104.70. Crude has been in a short-term correction since making a high of $109.32 on July 19. My sense is that crude could correct down to the $102 area to test support before rallying back to $111 or thereabouts in line with the rally in US equities and other risk assets.
However, I don’t think the $111 price will sustain for long and WTI crude will also correct down with the US equity markets, possible from the end of second week of August. The next flare-up in crude price should be used to exit longs.
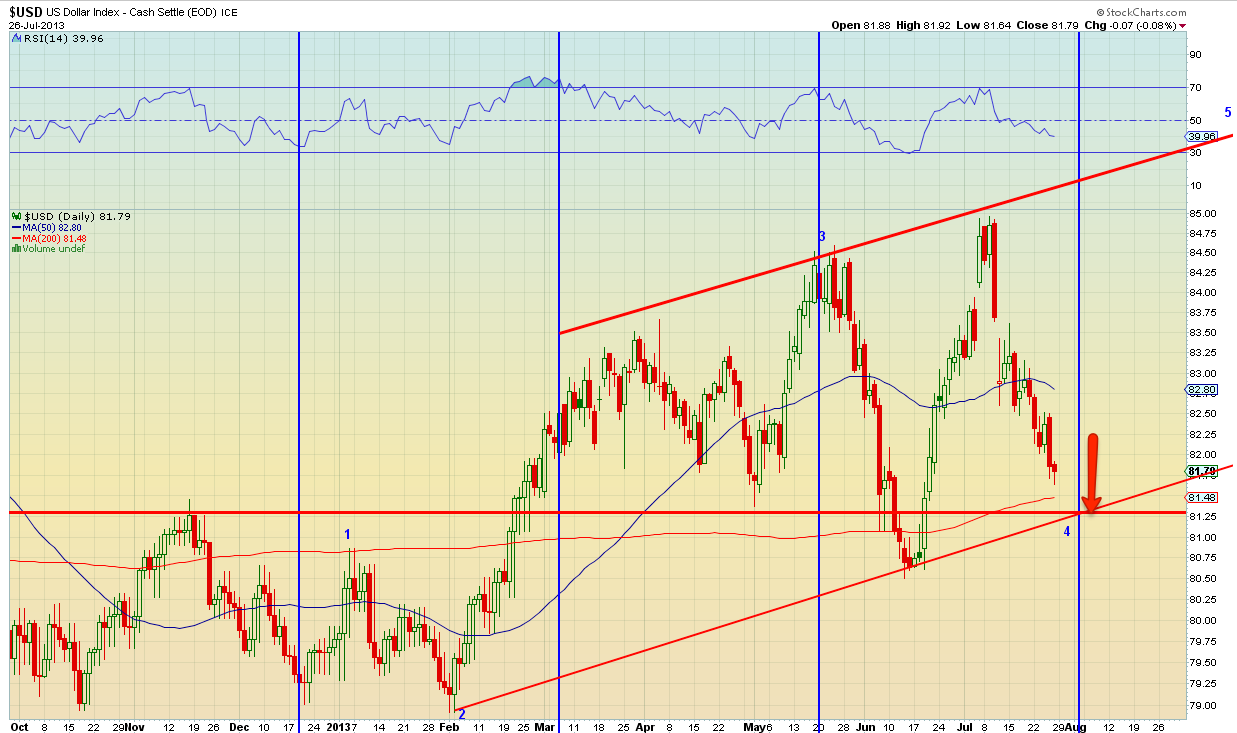 US Dollar, DXY: The DXY closed the week at 81.764, just above is 200 DMA 81.50. As suggested last week, the DXY is in wave 4 correction from its last top at 84.485. This correction had a target of something between 81.50, its 200 DMA, and the support at 80.50.
My sense is that the DXY could test 80.50 over the course of the next week and upon finding support there, is likely to shoot for its final target for this long rally to 85.50 or higher.
Clearly, DXY shooting for its previous top or higher will have grave implications for the $-INR market in India as well.
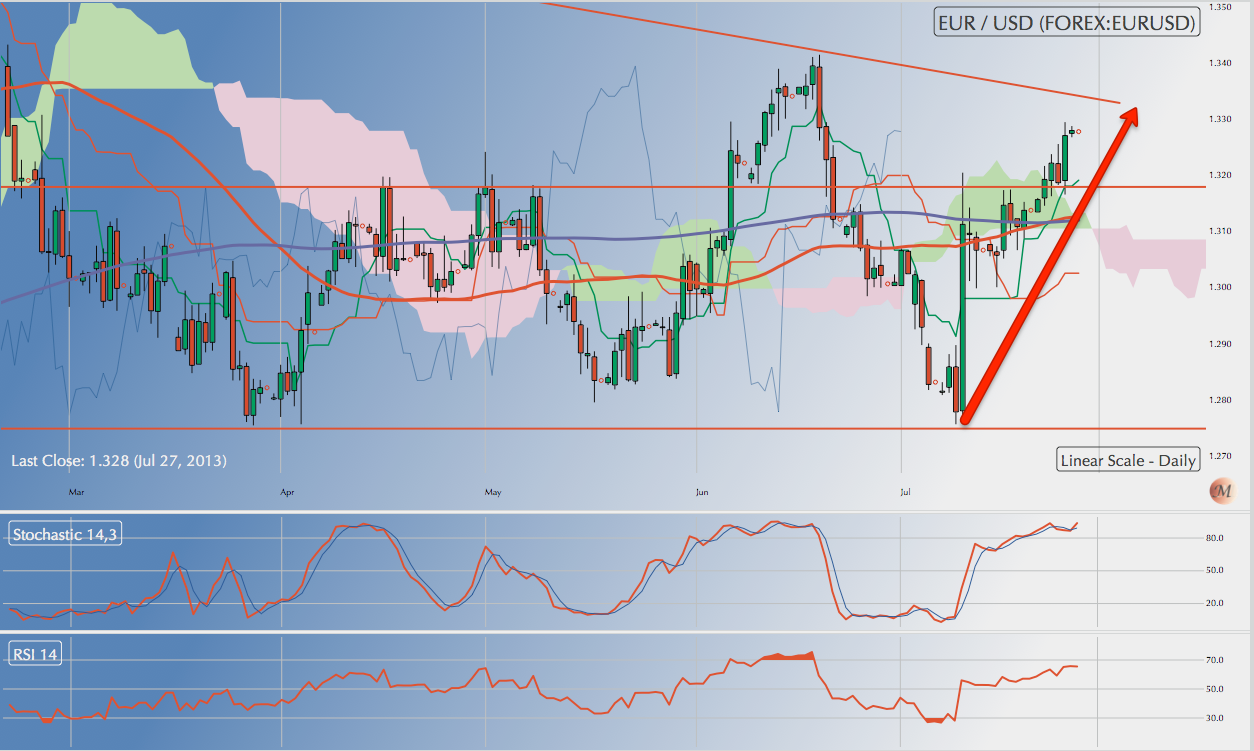 EURUSD: The EurUsd closed the week 1.3278, well above its 50 and 200 DMAs. Incidentally, the 50 DMA has just triggered a buy signal on the euro.
My target for the counter-trend rally now under way in the EurUsd was 1.3450. We could see the currency pair shoot for that level next week before it consolidates around that level. Not bullish on the euro beyond 1.35 at the most.
 USDJPY: The UsdJpy closed the week at 98.25. The wave counts I favour show the dollar in a “C” wave down from the top of 101.50 with a target of 94 or so. Clearly the dollar is correcting down in the yen markets in line with Nikkei. Its an upside-down world out there!
However, maintain my view that the long-term prognosis for the dollar in the yen market is still bullish and the top of 103.50 for the dollar will be taken out over next few months. Meanwhile, ride the dollar down to 94.
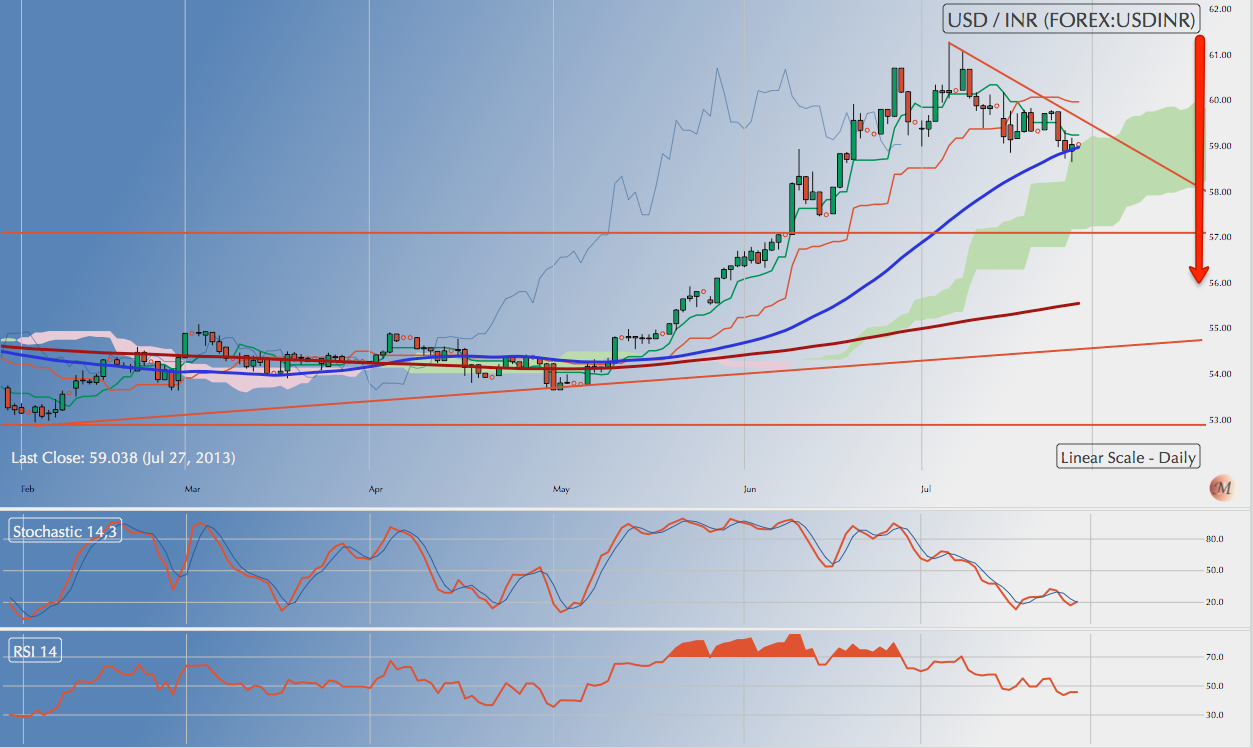 USDINR: Had indicated last week that the dollar would correct downwards and consolidate below 61, it recent high, and its 50 DMA which is currently in the 58.50 area. The UsdInr 200 DMA is way below in the 55.50 area.
Expect the consolidation in the dollar to continue. First support for the dollar lies at 59 and then again at the 58.50 area. The dollar could correct all the way down to 57 as the DXY tries to find a bottom around 81.50.
However, the respite from the dollar’s long-term bullish trend up to 85.50 or beyond, is likely to be very short-lived. I expect the dollar to be testing 61 again in another three to four weeks time. Maintain my target of 63.50 for the $-INR by the end of 2013.
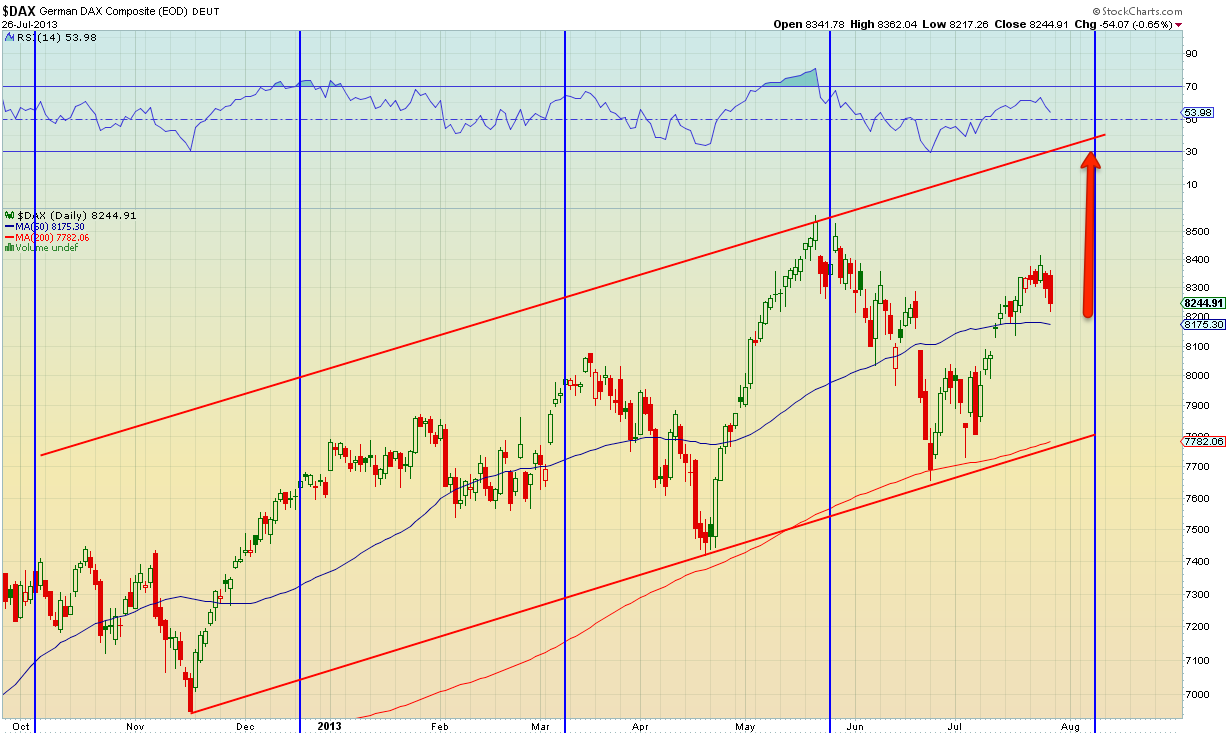 German DAX: No real change in the prognosis from last week. The DAX made a high of 8379.11 during the week before correcting down and closing the week at 8244.91, just above its 50 DMA.
The DAX remains on target to hit 8550 or better by August 9. After that expect a correction is due in the normal course but keep in mind that this could be the beginning of the long-dreaded intermediate correction that could last many months.
I would exist all trading positions at the next rally up that takes the index beyond 8550. In any case, I would exit all trading positions a day or two before August 9 if not earlier!
 Nikkei 225: I had expected the counter-trend rally in Nikkei from 12,435 to at least reach for the previous top of 15962. However, the rally topped out 14,589.91 on July 19, a key reversal day, whose importance I duly pooh-poohed last week! Such is life
The revised wave-counts favour a drop in the Nikkei back to the 1150 area in an intermediate correction that could last till the end of 2013. The Nikkei appears to have been the first major world equity index to go into an intermediate correction.
However, the long-term charts remain bullish and the rally from 700 levels on the Nikkei is far from over.
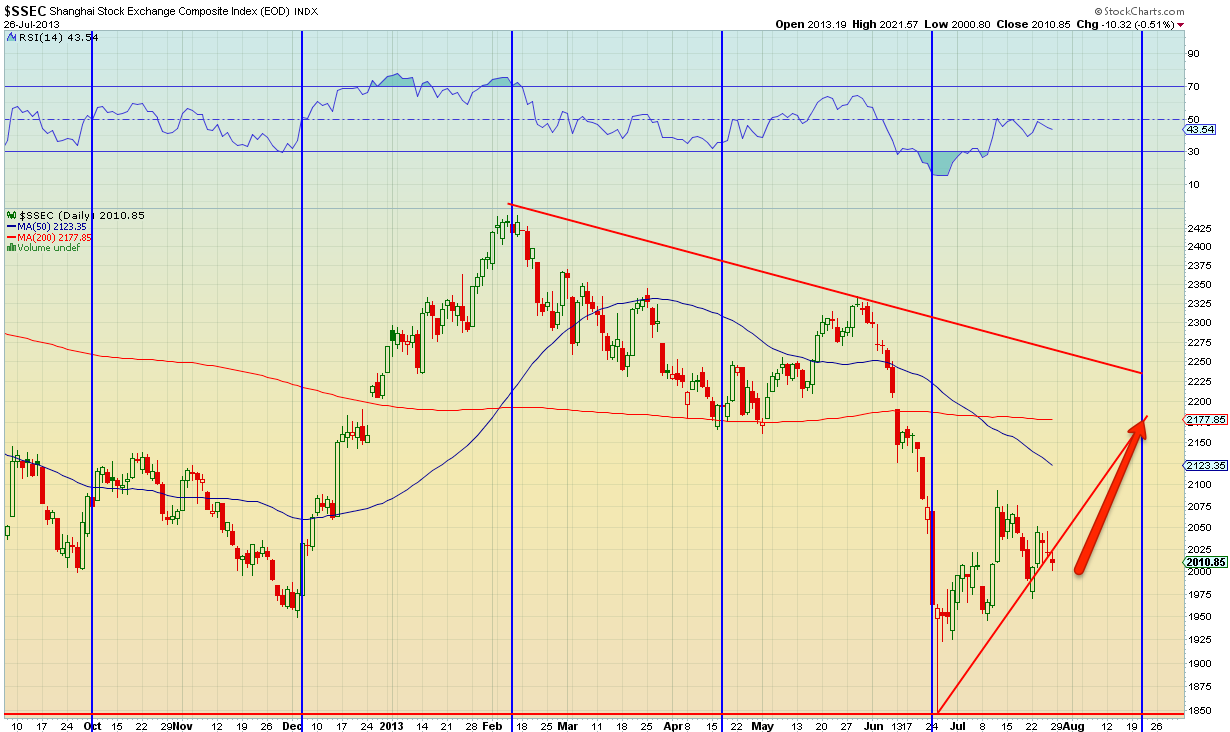 Shanghai Composite: No change from last week’s projection. Shanghai remains on target for a counter-trend rally from the low of 1850 to the 2200 area. However, no bets on the index after that as it is likely to correct along with the rest of the world markets though not as savagely as some of them.
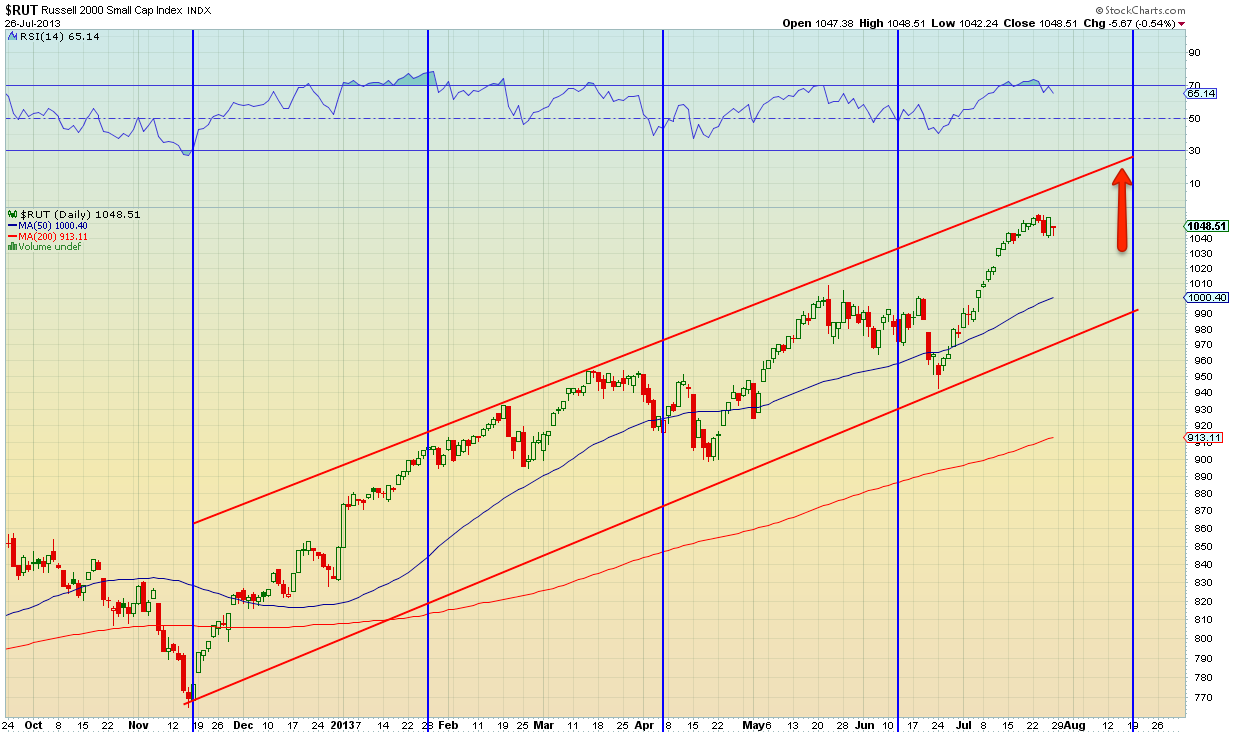 Russell 2000, RUT: Again, no change in the scenario from last week. The index corrected mildly after hitting a new high of 1056.86 on July 23 and remains headed for a target of 1090. I would rather watch SPY than rely on RUT for a sense of the direction of the market. But the index does give a clear sense of the froth building up in the US mid-cap space.
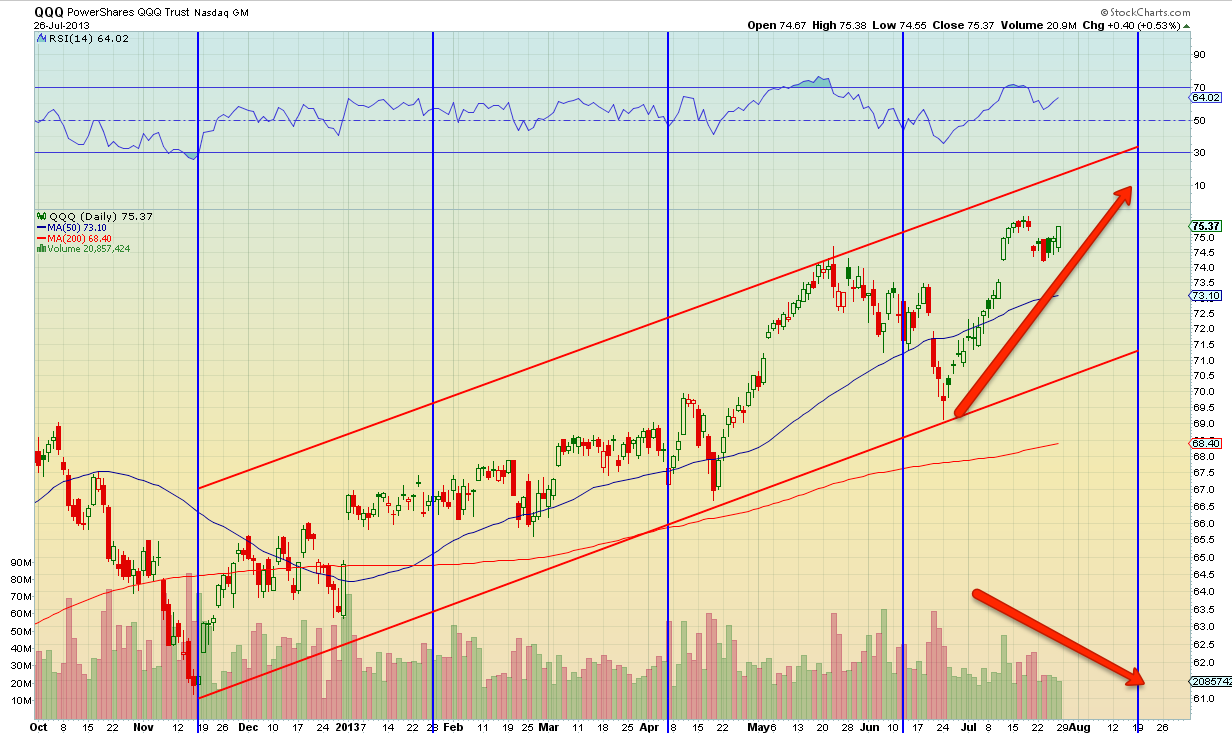 NASDAQ QQQ: The QQQ is used here as a proxy for the Nasdaq tech space.
The Nasdaq Composite closed the week at 3613.16 corresponding to $75.37 on the QQQ chart. The composite index is on course to hit its target of 3650 on the charts.
There are many indications that we are approaching the end of this rally before an intermediate correction sets in starting from the second week of August. The clearest divergence is between the volume and the price on the QQQ chart. The QQQ is not only trending up on thinner and thinner volumes but the volumes are relatively higher on down days.
I would exit all trading positions and move to the sidelines for now. Shorts should be established only after a top is confirmed.
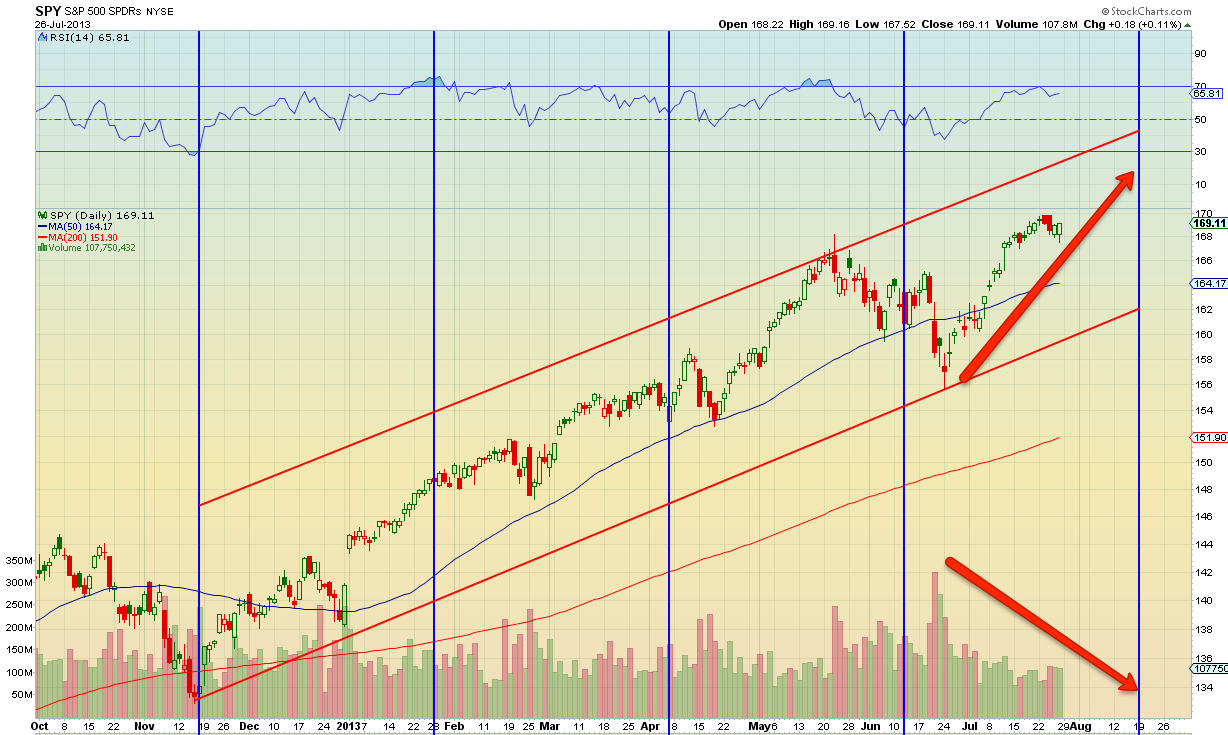 S&P 500 using SPY: The S&P 500 Index closed the week at 1691.65, corresponding to 169.11 on the SPY chart. The high of the two stands at 1692.39 for S&P 500 and 169.24 for SPY.
The divergence between volume and price on the SPY chart is fairly clear. Like the QQQ, the SPY is also going up on thinner and thiner volumes, and volumes on down days exceed the volume on up days. The divergence warns of an approaching reversal.
The wave counts indicate a correction setting in in the second week of August that could tip the market into an intermediate correction. It is hard to see the SPY shooting so high from here to a new top that the next correction would not take out at 1550. If it did, the following rally would not likely make a new high, flipping the market into an intermediate correction spanning many months. Wise to exist all trading position over the next two weeks.
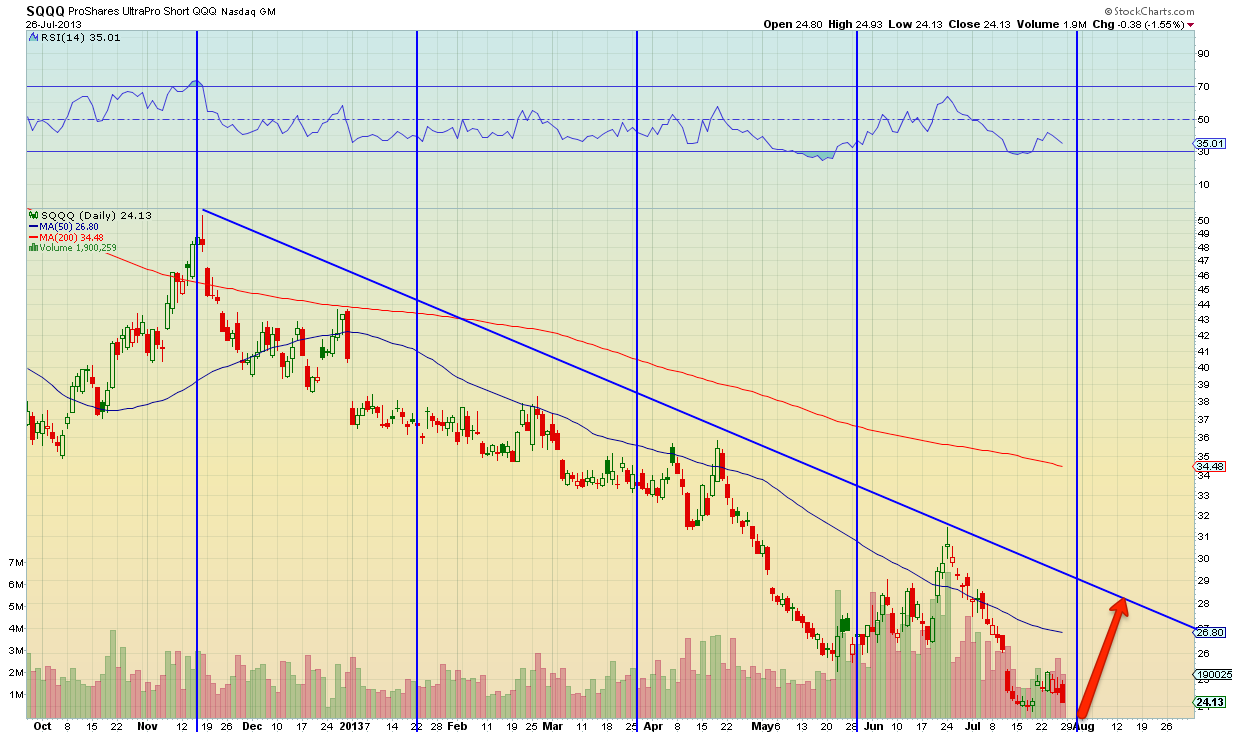 SQQQ: The SQQQ is essentially a leveraged short position in the QQQ share representing the tech space in the Nasdaq Index. It mirrors the QQQ, diminishing in value as the QQQ goes up in value. A bottom in the SQQQ indicates a top in the QQQ.
Can the SQQQ bottom out before the QQQ tops out? In theory the answer should be no but it is possible that people hedging long-term portfolios create a higher bottom on the SQQQ than justified by the value of the QQQ alone.
The point about the chart, though, is in the volume versus price. Note the explosive increase in volume as the SQQQ approaches a possible bottom or conversely a top in the QQQ. The insider, informed, long-term investor sentiment that would likely hedge exposure here in the SQQQ is overwhelmingly bearish as indicated by the cash flow on high volume days. It sort of confirms the price volume divergence in both the QQQ and the SPY.
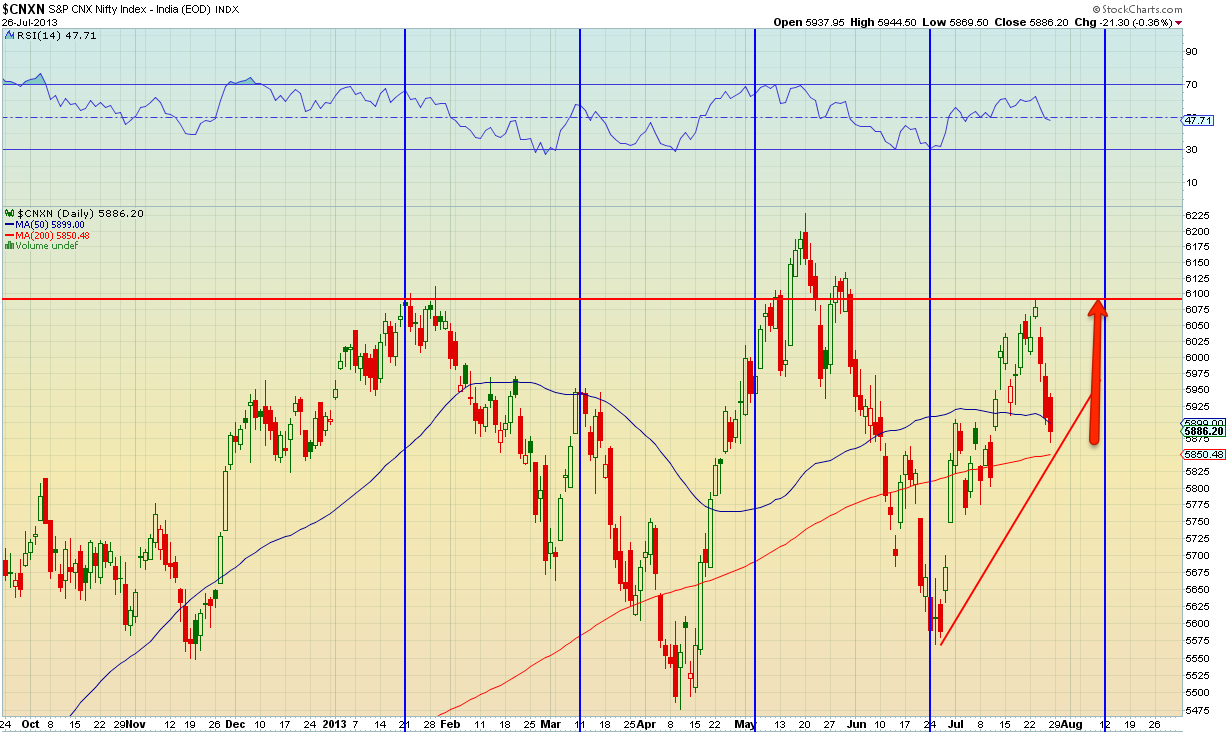 NSE NIFTY: The Nifty surprised by turning down sharply from 6093.35 following some pretty poor results in key stocks like L&T and a string of PSU banks. The Nifty closed the week below its 50 DMA in the 5900 area at 5886.20. It is just a notch above its 200 DMA in the 5850 area.
It is hard to see Nifty falling much below 5750 before rallying up again. Which is not to say that one is bullish in the Nifty. It is just that the rally from the recent low of 5550 is not yet complete and there has to be another leg to the pullback that could stretch the index to 6250 as envisaged in this blog last week.
On a technical rally to 6250 from 5700, one could see Nifty tip into a longish correction that rakes us to the end of 2013 along with the world markets.