 | « Back to article | Print this article |
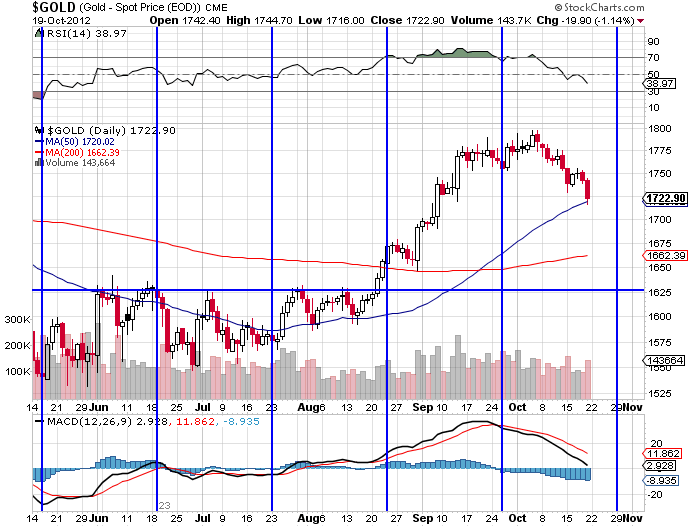 Gold: As expected, gold continued its correction from the recent top at $1795 and closed the week at $1721, slightly above its 50 DMA. The ongoing correction is far from over in terms of time and price although minor pullbacks from the trend will always be there.
From the price action so far, barring counter-trend pullbacks, the metal is headed towards a retest of the 200 DMA which is currently in the $1650 to $1660 area. The metal's reaction to that area will tell us if it intends to rally towards its previous top at $1920 or go into longer and deeper correction. The balance of probability points to a possible rally to the previous top if the floor at its 200 DMA holds. Watch that area for clues.
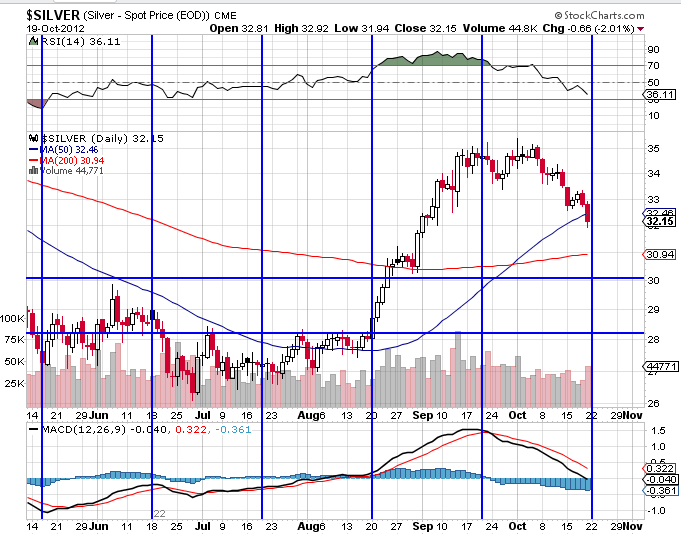 Silver: Like gold, silver too continued it correction from the recent top and closed the week at $32.05, below its 50 DMA which is currently positioned at $32.50. Its 200 DMA lies at $31.20 and may provide support in the ensuing week.
Silver's wave structure is unambiguously bearish for the long term and is distinctly different from that of gold despite superficial similarities. Upon taking support at our around its 200 DMA in the $31 region, the metal could rally again to retest $35. But a rally of the kind in gold that tests the previous top $50 is not on the cards in the near future.
Upon a pullback from the $31 area, look for opportunities to sell in the $35 area. But before that, let us see if the metal does take support at $31!
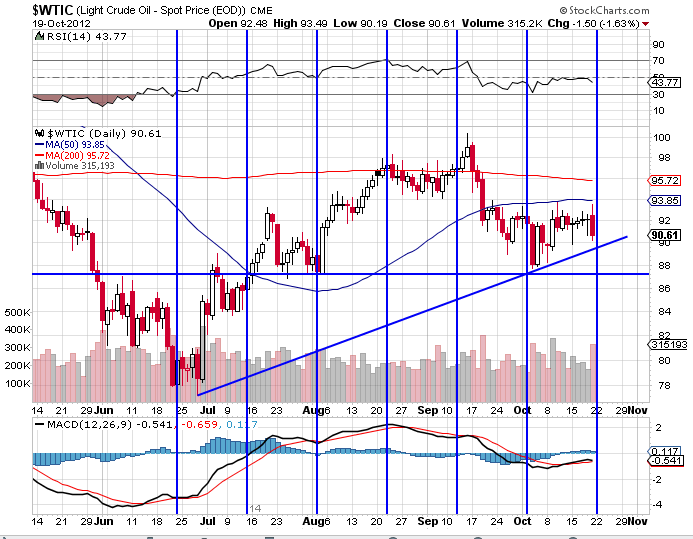 WTI Crude: As expected, crude continued its correction from its recent top at $100.50 and closed the week at $90.05 well above the baseline of the uptrend showed in the chart above.
Essentially, the correction in crude for the rally from $77.50 to $100.50 is over both in terms of time and price. Crude should therefore rally upwards from its current level of $90.05. Its first overhead resistance lies at $93.85 which is its 50 DMA followed by its 200 DMA $95.72. It may not make it to $95 in the next week or two but will reach for that area.
First support lies at $87 which is where your stop should be. A breach of $87 will completely negate this analysis and open the way for a retest of the recent floor at $78. However the probability of such a scenario looks remote given the wave counts.
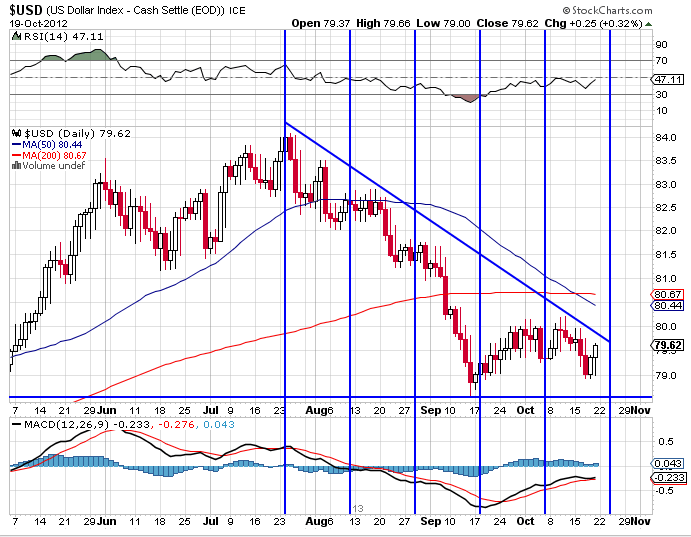 US dollar: The US $ is correcting in a text book fashion from its recent top 84.25. In this correction it has already made a low of 78.6 on September 14 and is currently in a counter trend rally that will be capped by its 50 and 200 DMAs, both of which are overhead in the 80.50. The $ closed the last week 79.6880.
While a rally to the 80.50 is likely in the ensuing week, the longer time frame correction from 84.25 is not over and will likely have a second leg that will retest 78.50 area. Look to sell the $ on a rally to 80.50 area with a stop loss just above its 200 DMA.
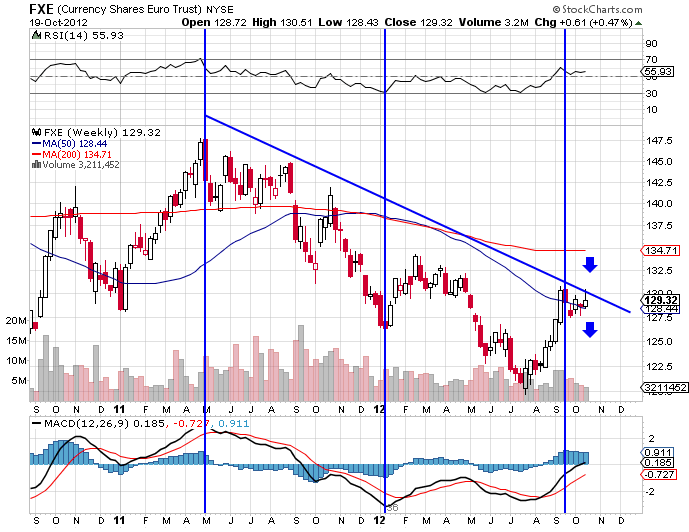 Euro$: As expected, the euro$ continued to correct from its recent top at 1.3175 and closed the week at 1.3021. The Euro did attempt a counter-trend rally from the low of 1.28 for the previous top but turned down well before that level.
Barring small counter-trend rallies, the euro is now set for a retest of 1.28 level in the next few weeks. If that level is breached decisively, the currency would unleash a destructive C wave its ongoing correction from the top of 1.5000 whose target could be 1.2000.
So watch the 1.2800 level like a hawk. Keep a stop loss just above 1.32 for shorts. A rally above that level will negate this analysis.
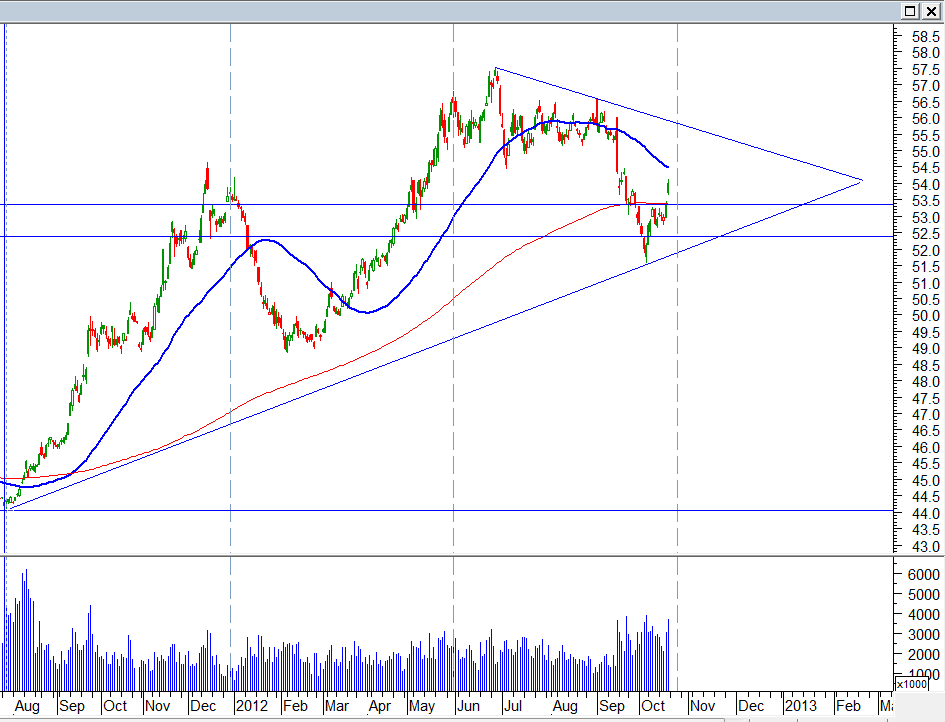 $-INR: The $ pulled off a surprisingly sharp rally from 51.50 to end the week at INR 53.99.
The $ has surprised both to the downside when it breached 52.50 and now to the upside by taking out its 200 DMA currently at 53.40. Apparently, trading discipline is not one of the virtues of $-INR market!
The $ is unlikely to go higher than INR 54.50 which is its 50 DMA overhead in the current rally. In fact, it should reverse well before that to [a] retest its floor at INR 53.40 which its 200 DMA and on a breach of the same, the congestion zone just above 52.50. There is time and room for such a retest and confirmation of the floor for the $ in the 52 region before a meaningful rally develops.
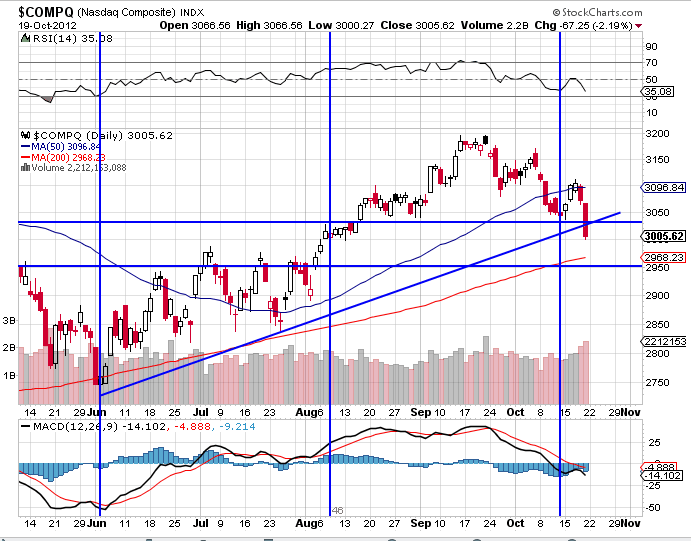 NASDAQ Composite: Essentially, I have reproduced last week's chart firstly because it requires no change except to mark the next support and secondly to show the technical damage inflicted on the index by earnings disappointments by Intel, IBM, and Google. Note, the index rallied from 3040 as expected to 3096 which is also its 50 DMA before going into an unexpected fall breaching the base trend line of the rally to close the week at 3005.62. Is the party over?
There is no doubt that the breach of 3040 again has thrown up a very significant crack in the markets. The breach of the base trend-line underlines the weakness. However, the index could take support at the 2950 level, which is a significant support, and also the 200 DMA, and rally decisively from there to reclaim the 3100 area. But unless it does do that, and does it quickly, we could see a complete breakdown in the index.
As mentioned last week the markets is skating on thin ice of an extension that can reverse on a dime.
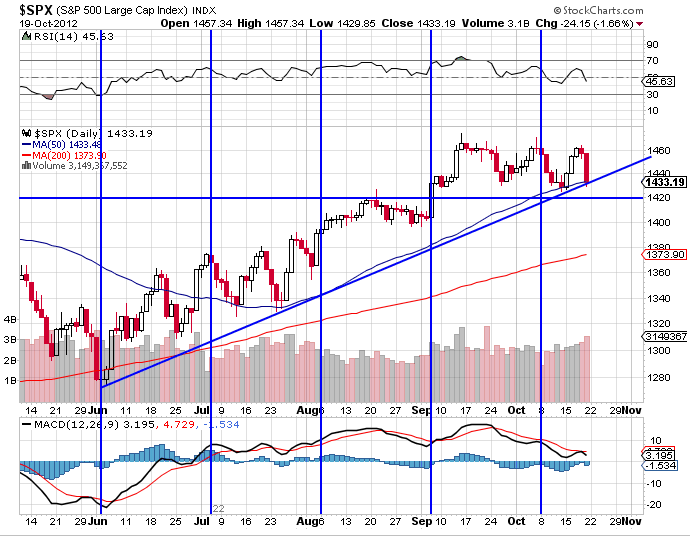 S&P 500: The technical position of S&P 500 [SPX] is much better than that of the NASDAQ Comp. The index too corrected with the NASDAQ and is currently positioned at 1433 testing its support at 50 DMA and the base trend line of the current rally. A further fall below 1420 would certainly call the entire rally into question. But the disaster hasn't happened yet. It only threatens at this point.
Structurally, if SPX reverses course above 1420 and quickly reclaims the 1475 area in the next three or four trading sessions the technical damage would repaired. Furthermore, SPX's correction so far is at a place where one would expect to have one. So it's not a surprise as in the case of NASDAQ.
That said, SPX like NASDAQ is also on an extension & can turn on a dime. Place stops at 1415 and get out if the level is breached.
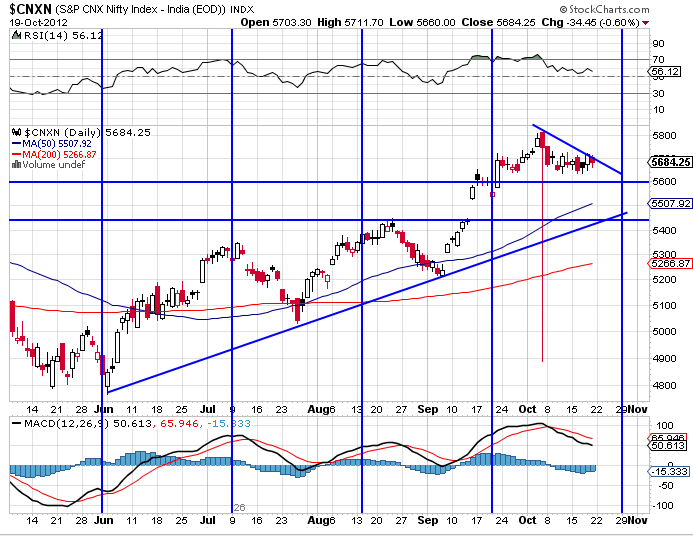 NIFTY: The Nifty continued its correction in an expected and orderly manner closing the week at 5684.25. The correction is likely to continue until the end of October and has a first target at 5530 followed by a deeper target at 5450. As long as Nifty remains above 5400, the scope for a rally after this correction to 5850 and beyond remains intact.
A breach of 5450 would a free fall. So it is time to be cautious on Indian markets as well if the US markets show signs of taking out further supports. However, apart for the breach on October 5, there is nothing on the Nifty charts to indicate imminent danger.
NB: These notes are just personal musings on the world market trends as a sort of reminder to me on what I thought of them at a particular point in time. They are not predictions and none should rely on them for any investment decisions.
Sonali Ranade is a trader in the international markets