 | « Back to article | Print this article |
NIFTY has now moved into a bull phase though there will be corrections on the way, but some of these could well be running corrections, says Sonali Ranade
The "fiscal cliff" was one more instance to show that so-called "fundamental events" is usually factored into the price charts much before the event. Usually, but not always! In the event, bears were forced to cover shorts in risk assets. The rather strange moves in prices, after the fiscal cliff sailed past, showed the way bears had placed their bets and hedges. Gold, Silver, Oil and USD rallied on bears unwinding their hedges!
With the cliff having receded, normal business returns to markets. That means markets will continue their long-term rally that started in March 2009. We are into very mature bull markets in equities in the US and EU. Long-term bull markets do not end in a whimper, so some kind of top formation is certainly on the cards.
My guess is that this bull phase will end in toppish market by end of February. That will not end the bull market. But it will be a fairly serious correction that will appear more like a bear market than a correction in its intensity and depth. With that caveat, it is time to ride the wave. Don't get greedy on the way though.
Indian markets have had a serious correction in 2011 while US and EU markets rallied on. They aren't as "stretched" as the western world's markets. Asian markets, on the other hand, may be on the verge of new bull markets. Both Shanghai and Nikkei are coming off multi-year lows fuelled by liquidity and valuations.
Will the Indian markets also chart an independent course? Too early to tell but safe to say peaks and troughs will be coordinated enough in time. PSU banks, steel mills with owned mines, cement are some sectors that look attractive on the charts in Indian markets.
Next logical target for the Nifty has to be 6350, the previous top. Can it be done before the US markets correct? If so, Indian markets would also have to go parabolic. That is something only time can tell. Gold: Gold closed the week at $1648.9 after having made a low of $1626 on Friday. With this move below its 200 DMA, Gold has confirmed it is in wave 3 down from the top of $1797 on October 4.
Gold could come up with more deceptive moves as it drifts below $1640 over the next few weeks. However, the long-term trend is firmly down and an eventual retest of $1525 is still on the cards.
A decisive close below $1640 will trigger the next move down.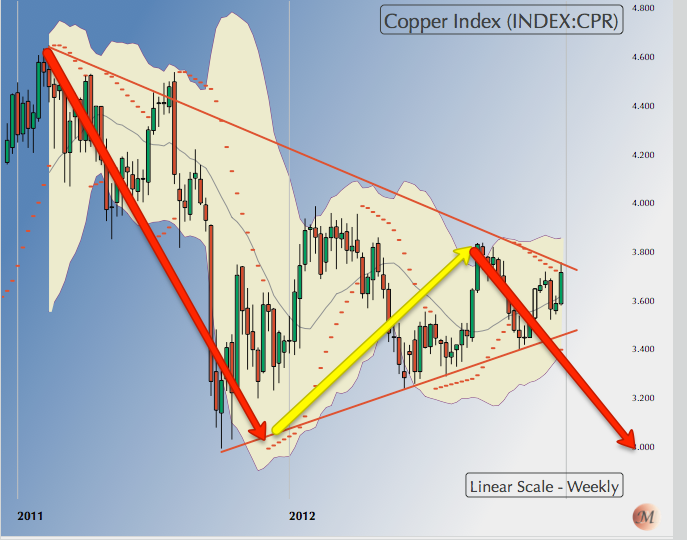 Copper: Silver closed the week at$29.95. It could pull up from the $28.50 region to just under its 200 DMA. That it is headed towards the $26 region is a no-brainer. So we examine the more interesting case of Copper this week.
Copper closely mirrors the CRB Index and has a rather intricate and fairly deceptive weave to its fractal patterns. Nevertheless, sometimes the overall structure of the fractals becomes obvious as shown above.
Copper moved down from 4.6 to 3.1 in the first move down shown in the bigger red arrow. It then moved in a corrective move up from 3.1 to 3.8. [Yellow arrow]. The next move should be down to a retest of 3.1 again although this move can fail partially and terminate earlier than 3.1.
Some traditional TA, that ignores the fractals, would treat the above chart as a case of triangulation and get hopelessly lost in the wave count. It is in many respects triangulation, but in terms of fractals not just up & down waves.
A move up beyond 3.8 would negate my analysis completely. On the other hand a move below 3.7 would validate a further move down to at least 3.4 and indicate a retest of 3.1 is on the cards.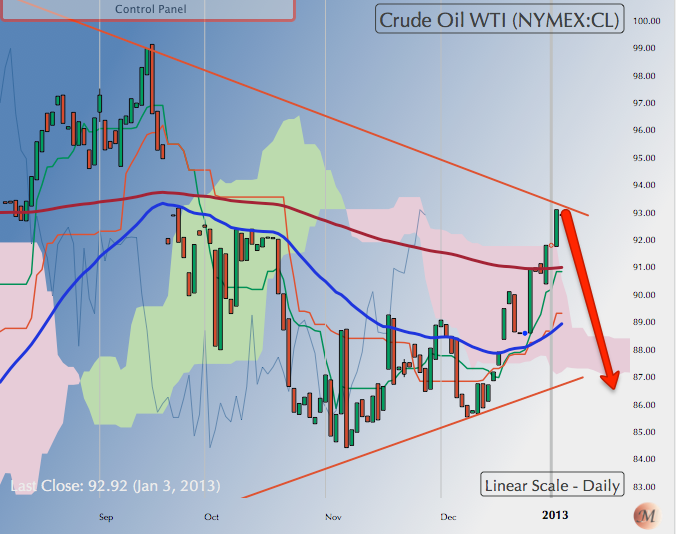 WTI Crude: Crude too made deceptive moves to the upside prompted by short covering in risk assets across markets as the "fiscal cliff" scare evaporated. Crude closed the week at $93.09. As in the case of Copper, this level is deceptive and unlikely to hold up over the next few weeks. Expect crude to fall back below its 200 DMA at $91.75 and drift towards $87 level over the next week or two.
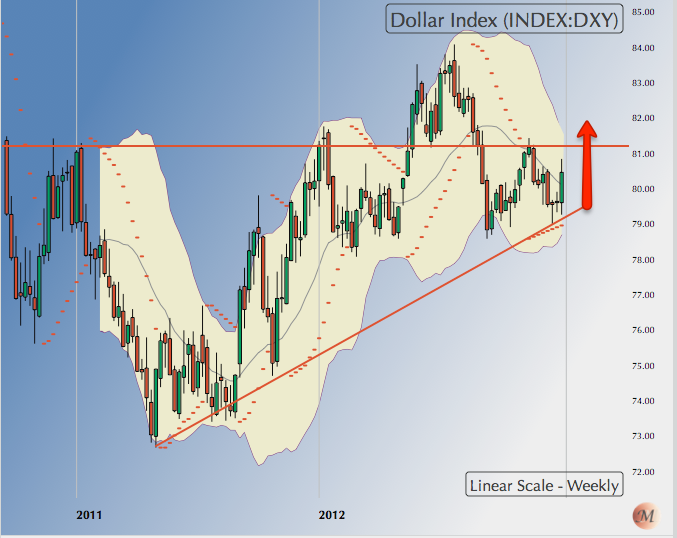 US Dollar: The $ moves during the week indicate that the correction in the $ underway since the top of 84.17 on July 24 may have terminated at 79.31 on December 19. DXY closed the week at 80.61, well above its 50 DMA and just below its 200 DMA after having nicked it.
Over the next week, the $ could move down to test its support at 80.40 before drifting up. The intermediate down trend in DXY is now over and we can expect it to resume its slow but steady drift back to 84 over the next month.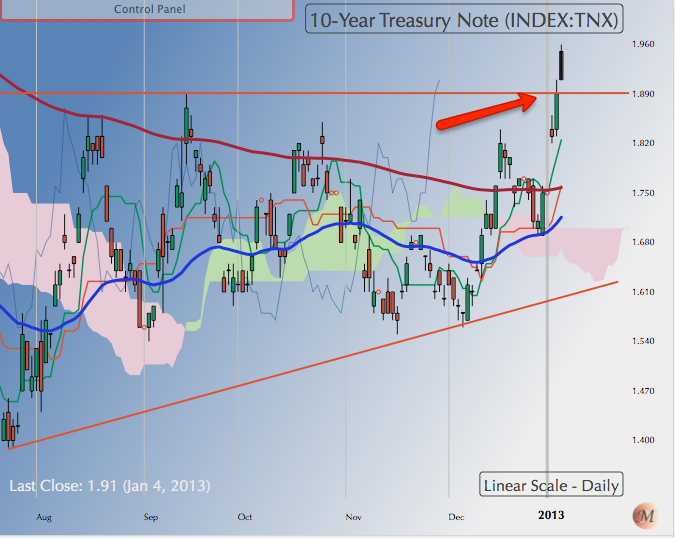 10-year treasury yields: US interest rates have been at their all time lows over the last four years and cheap money and ample liquidity the chief driver of asset prices. Is that about to change?
Treasury yields on 10-year notes spiked above 1.89, a key resistance level since August of 2011. That breakout of a range could be significant. Furthermore, the lows of the yields since August of 2012 have been trending up as seen in the chart above.
With Fed bond buying ending, yields may creep up over the next weeks and months. We will begin watching this space from this week onwards. EURUSD: EURUSD surprised by tanking below 1.3150 abruptly as the rally in the DXY took off. While the tanking was a surprise, the move down is actually the last leg of a correction down to 1.30 support.
If the EURUSD holds above 1.29 over the next weeks or 10 days, we could see the resumption of a strong uptrend in the EURUSD. Despite the steep fall, the rally in EURUSD is far from over.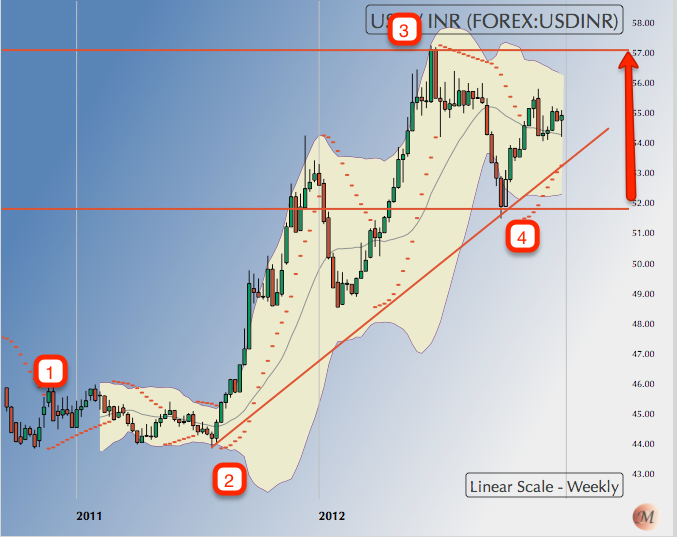 $-INR: For a variety of reasons, I have been bearish on the INR for many months. From the charts above, it should be clear that I am bullish on the $ and conversely bearish on the INR. That will not change until $ moves below 53.50.
The $ closed the week at 54.93 after bouncing from its 200 DMA 54.45. That is bullish for the $ over the next week or so. The $ could drift up from here to 55.50 which is a very strong overhead resistance. This may not be breached next week but will surely be tested. S&P 500: I was one of the few to ignore the noise and din of the "fiscal cliff" and proceed purely in terms of the technicals and wave counts, which indicated that the correction preceding was a wave iv correction and wave v was yet to come. Happily, that proved to be the case and the wave v could extend -- by my reckoning to mid-February.
That said, SPX closed the week at 1466.47. In terms of the body of the candles, that's a bit higher than the high of September 14, 2011. The index could correct from here to 1450 or so. But a more likely course is a vault over 1465 before coming back to test that level as support since the bulls are unlikely to give away any gaps from hereon.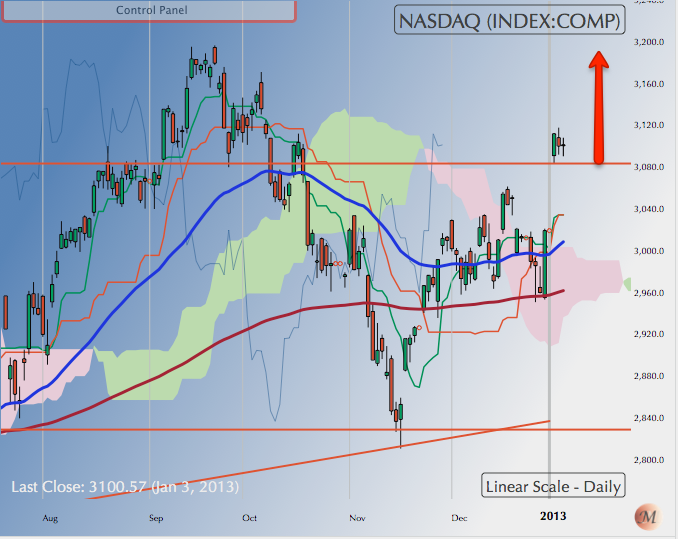 NASDAQ Comp: More than the SPX, the NASDAQ Composite illustrates the gaps in the markets charts that delineate price levels at which the bears are trapped. The bulls are unlikely to give away these gaps before the end of February, ie, for the rest of this bull move, which could be the wave v of 5 of V albeit with extensions.
If my hypothesis is correct, NASDAQ is unlikely to fall below 3080 even as it corrects and will shortly resume its climb back to 3200.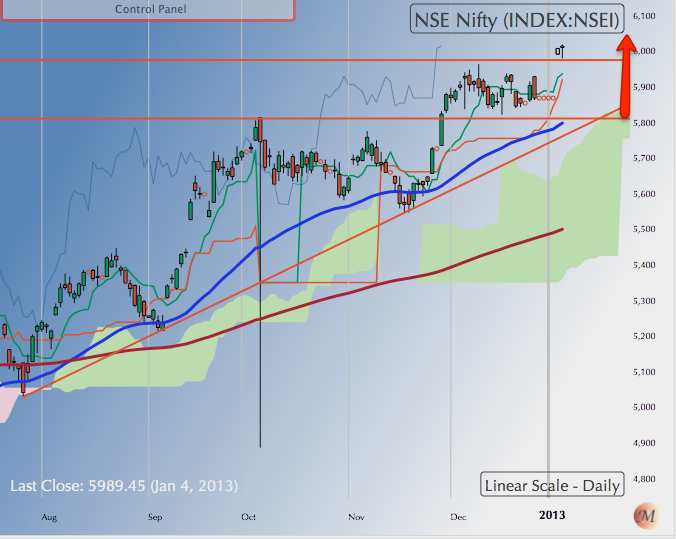 NIFTY: As expected last week, NIFTY climbed over the 5950 hurdle and closed the week at 6016.15. As I had argued last week, the NIFTY's rally may track the US markets but it is moving to a logic of its own. In this it is somewhat like other major Asian markets such as the Nikkei and the Shanghai Composite which are coming off deep corrections.
That said NIFTY has now moved into a bull phase whose target could be the previous high of 6350. There will be corrections on the way of course but some of these could well be running corrections.
I would give the NIFTY clear skies at least till Mid-February or such time till the US markets indicate a top. Expect NIFTY to correct in line with the world markets then.
NB: These notes are just personal musings on the world market trends as a sort of reminder to me on what I thought of them at a particular point in time. They are not predictions and none should rely on them for any investment decisions.
Sonali Ranade is a trader in the international markets