 | « Back to article | Print this article |
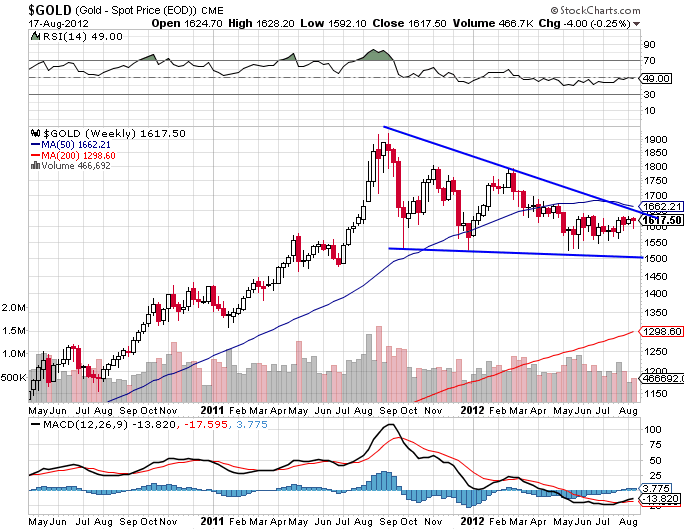 Gold [$GOLD]: The pull-back in gold from the low of $1526 in May this year has been exceptionally weak. Gold closed the week at $1615.30, well below its 200 DMA which is currently at $1645. One would have expected gold to at least challenge the 200 DMA and rally to perhaps the $1660 region. But it did not happen, a fact which points to future weakness ahead.
As per my wave counts, the time cycle for a pull-back is exhausted and we could see weakness reassert itself in the gold price going forward. In the ensuing downturn that could last months, I expect the floor at $1525 to be severely challenged and possibly be breached. Note that all through the pull-back period the traded volumes in gold have been declining.
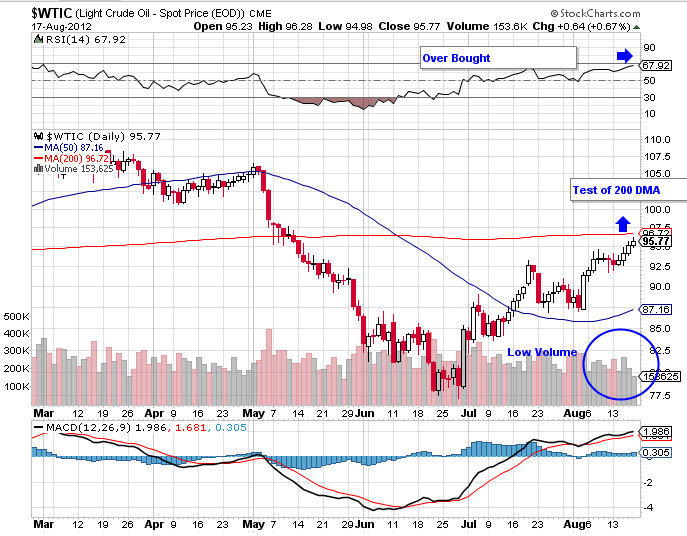
WTI Crude: I have been bullish on WTI crude the past few months and it did not disappoint, closing the week at $95.23 after making a high of $96. Crude has had a long rally from the low of $77 in July this year to $96. It is now showing signs of an impending correction although the shape and size of one remains indeterminate. In a very strong uptrend such as the one under way in crude, corrections can be perfunctory.
On the charts here, traded volumes have not matched price action, while the price itself is all set to challenge the overhead resistance represented at crude 200 DMA. The RSI shows crude is overbought. Taken together, these factors point to an imminent correction in crude price.
US Dollar [$USD]: The Dollar Index has entered a correction 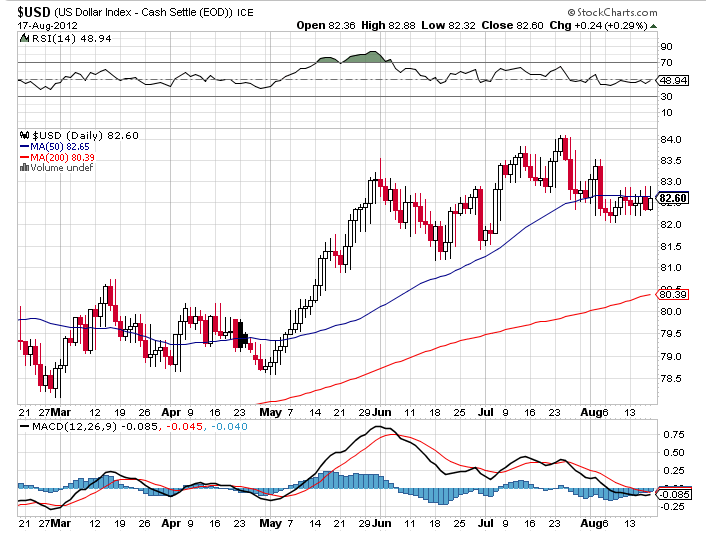 mode from its recent highs at 84.14. The correction has weeks to run yet and the price action could be fairly choppy. The first major logical target for this correction remains 81, followed by a deeper floor at 80 which also is the Index's 200 DMA that is unlikely to be breached.
Dollar could spend the ensuing weeks in the 81-83 range. Trading is best avoided in the ensuing sideways market with limited price range. However, in the medium and long-term, the dollar remains bullish and may be bought on dips to its 200 DMA whenever that happens.
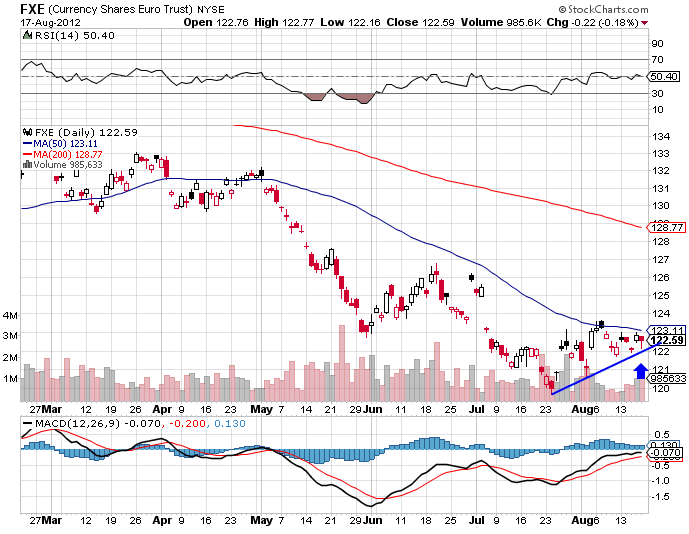 Euro$ [FXE]: The euro's correction to the run-up to $1.2450 from its recent low of $1.20 has been rather mild and may be over. The euro closed the week at $1.2330.
The euro remains in an uptrend with first major overhead resistance at $1.24. Note, traded volumes in the euro favour upticks in price while its RSI is in neutral zone. Its 50 DMA is around 1.23. In the ensuing week, the euro could aim to take out the 1.24 resistance and fill the gap in the charts between 1.23 and 1.25.
The above doesn't mean long-term bullishness in the euro. But the upward correction will provide clues to the future shape of the price movements in the currency. The ultimate target for this uptrend could be 1.27 to 1.28.
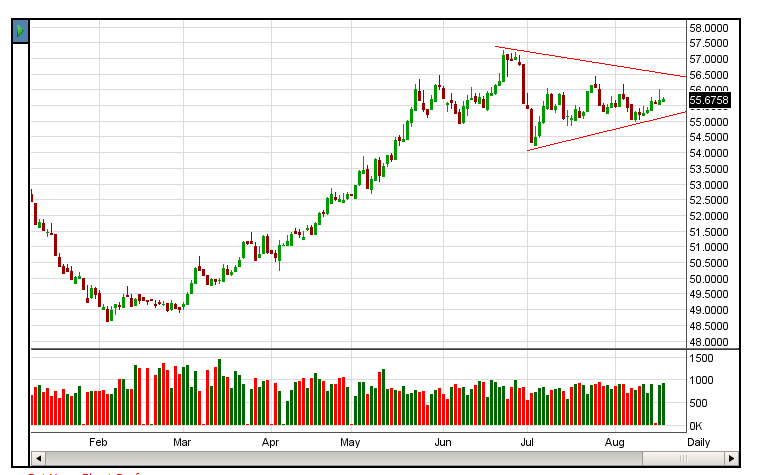 $-INR: After its recent high at 57.30, the dollar has been correcting but the correction has been unusually mild considering the sheer run-up before the top. That leads one to believe there could be further upsides to the dollar against the INR after a period of consolidation.
On the charts, the dollar is ambiguously positioned in the short-term. The next few trading sessions could resolve the ambiguous picture. The level on the upside is 56.20. On a breach of this overhead resistance it would be safe to assume that the correction is over and the uptrend has resumed.
A breach of the floor at 55.40 would indicate some more period of consolidation. Either way, the dollar remains a buy on all dips since the uptrend in the dollar is unlikely to have been exhausted. Remain bullish in the long-term.
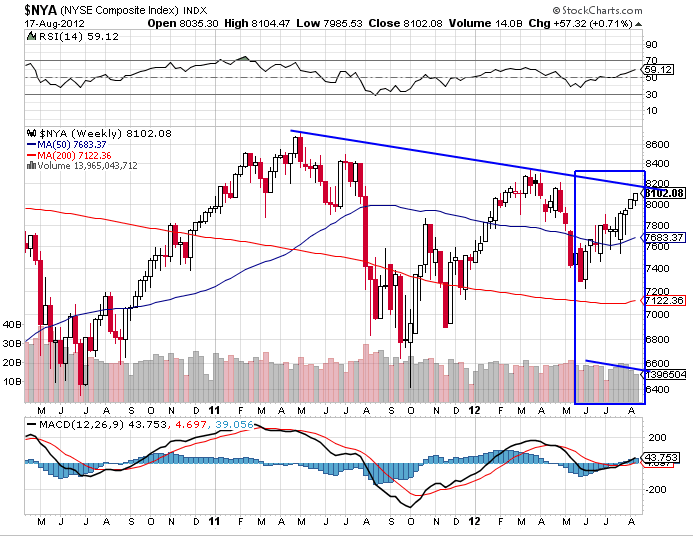 US Equities: From time to time, it is good to see the broad market in order to place the movements in narrower indices in a larger perspective. This is necessary since the authorities periodically remove under-performing stocks from the major indices and replace them with better performing stocks that gives the major indices a bullish bias that may be lacking in the broader market. The NYSE Composite Index is the universe of all stocks listed on NYSE.
In the rally underway, note traded volumes decline even as prices move up. That's a dangerous divergence by itself towards the top of a rally. Note also that the index is now in over-bought territory but not by a margin that indicates an imminent correction.
Lastly, note that the price is now up against on overhead down-sloping trend line through the previous two tops that indicates a major resistance overhead. Such trend lines are rarely breached except by a small nick for 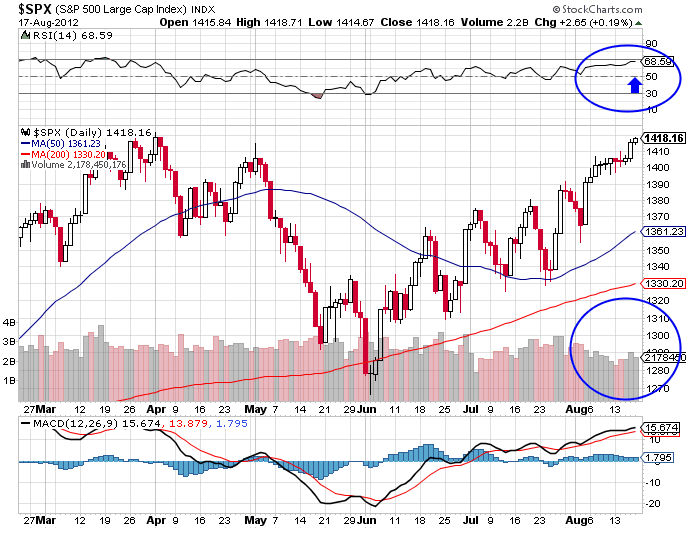 a short time. All of the above point to an imminent market top. It could happen in a day or weeks; but we are pretty close to one.
Having looked at NYSE Composite, take a look at the S&P 500. First, SPX closed at 1418.16 which is pretty close to the previous top at 1423.19. In a major downtrend like the present one, previous tops are rarely breached. Second, traded volumes in the blue circle show a disconcerting trend downwards even as the index moved up. That doesn't indicate a healthy rally. Lastly, note the RSI which indicates an overbought market though not dangerously so.
While the price action in the SPX is clearly not as bearish as the one in NYSE composite, the other crucial parameters bear out the bearish bias of the composite index. In my view the US equity markets will soon run out of steam. Maintain my earlier view that the US markets are very close to a top.
Sensex: The Sensex broke atop the downward sloping trend-line connecting previous tops in the current down-trend. Its 50 day DMA has just crossed above its 200 DMA -- a golden cross though folks in Mumbai don't pay this that much attention. And the Sensex itself closed at 17,691 atop the downward sloping trend line. All in all, pretty bullish price action, that. 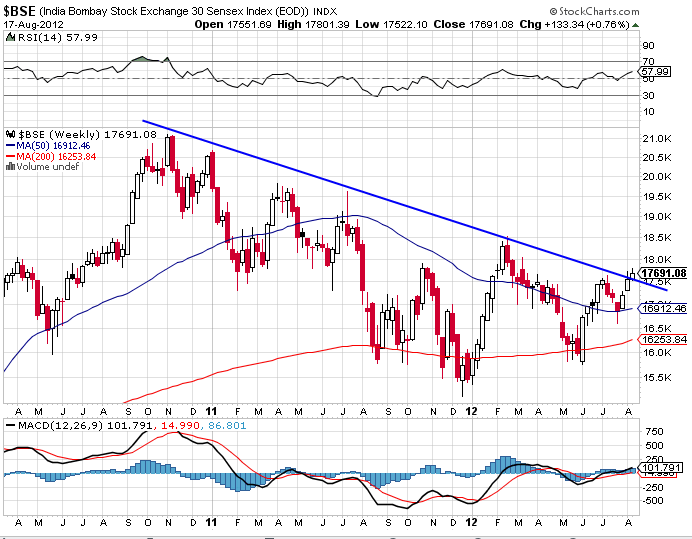
While the rally could extend in time and price to 18,500, I am not sanguine about the sustainability of this rally despite all the breakouts, golden cross-over and the like. There are many reasons to be skeptical of this rally. I shall briefly point out a few things to substantiate my point.
The Sensex is a pretty narrow index. In fact, it is just 30 stocks compared to the 500 in the S&P 500 which itself is much narrower than the total markets represented by the NYSE Composite in the US. And we saw the divergence between SPX and NYA in the note on US equities. We don't have a composite index for the BSE or NSE. So I have used the BSE 500 to study the divergence between the Sensex and the broader market. Note, the BSE 500 did not make a new high or even come close to the 2008 top in November 2010. So the broader Indian market is in a firm, long-term down-trend from 2008 as per the BSE 500.
The BSE 500 wave count is much clearer than on the Sensex and indicates that the present rally is merely a correction to the drop from 8460 to the low of 5655. We may have a week or more to run with the uptrend and the Sensex could try for 18,500 but the current rally is not the beginning of a new bull markets. For that more time and price correction is necessary.
Within the Sensex, the financial sector presents which is about 30 per cent of the market-cap, presents divergent trends. The private banks including institutions such as HDFC are showing strength in the counter-trend rally, while the PSU banks show major weakness across the board. In both the cases, the correction has lots of time to run. Remember that the financials in the Indian market peaked in 2010 and not 2008 with the other stocks.
That said, a few major stocks like RIL, HDFC, HDFC Bank are poised at crucial junctures that could indicate the strength left to fuel a further counter-trend rally. On the other hand, PSU banks should be watched for weakness to assess how far this rally can go.
Apart from HDFC Bank, which continues in a strong uptrend, I would rather spend time accumulating good blue chips that indicate that prices have bottomed out. This rally is not worth chasing.
NB: These notes are just personal musings on the world market trends as a sort of reminder to me on what I thought of them at a particular point in time. They are not predictions and none should rely on them for any investment decisions.
Sonali Ranade is a trader in the international markets