 | « Back to article | Print this article |
There is no indication that the rally in the dollar is likely to end soon, says Sonali Ranade
The week past was really about the onset of deep correction in commodity prices triggered by a strengthening US dollar. The CRB CCI Index of 17 equal weight commodities broke a long held support at 550 opening the way to a correction that could go all the way to 450.
Meanwhile the dollar, represented by DXY, continued to gain strength, moving up from 81 to 82.5 over the week. There is no indication that the rally in the dollar is likely to end soon. Since commodity and other risk asset prices correlate negatively to the value of the dollar, a breakdown in commodity prices was only expected.
Equity markets in the US, EU and Asia also confirmed the onset of an intermediate correction. It is too early to say what shape the correction will take in each market but it may not be anything like the crash of 2007 as some expect.
Nearer home, the NIFTY had clearly anticipated the correction in US markets even as it followed a rhythm of its own. Barring select sectors like FMCG, pharma, private banks, most stocks have already seen fairly steep corrections and are close to their lows or have already made them. Long-term investors should ignore the Index and look to buy the lows on the merits of individual stocks.
Stick with the blue chips.
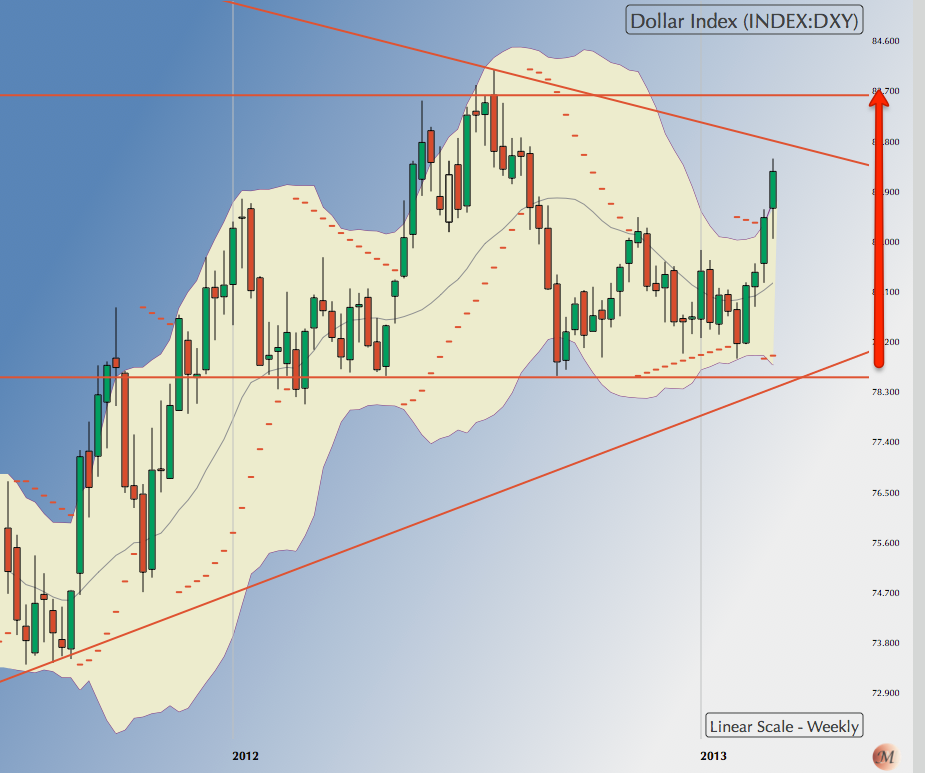 |
US Dollar [DXY]: DXY closed the week at 82.358 after making a high of 82.58. The DXY is clearly in a very strong uptrend as money rotates out of world risk assets back into USTs. Yields on 10-year USTs have dropped from about 205 to 185 basis points. There is no indication that the trend is about to reverse. The DXY could continue to trend up with minor pullbacks to consolidate above 81.50. The next logical target for DXY is 83 followed by the previous top of 84.25. Given the momentum and the wave count, DXY is likely to takeout the previous top of 84.25 over the next six to eight weeks. |
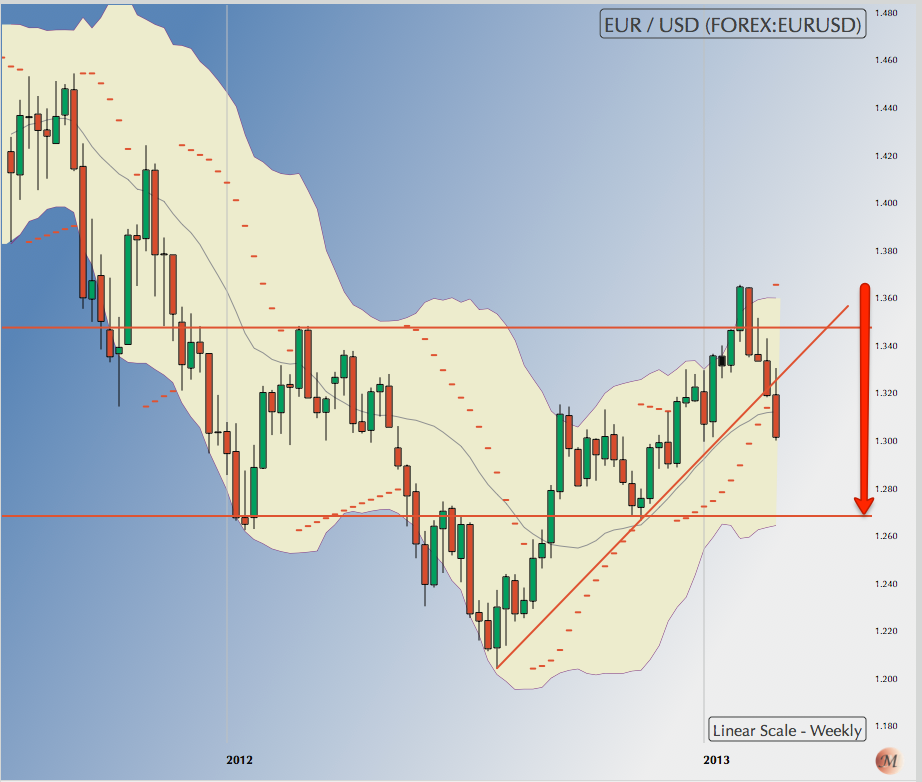 |
EURUSD: gthe EURUSD closed the week at 1.3020 after making a low of 1.2965. The correction in the Euro from its recent top of 1.37 continues. The euro has its first support at its 200 DMA currently placed at 1.2840. Not clear if the correction will stop there. The 200 DMA is followed by another support at 1.27. A 50 per cent correction of the rally from 1.2 to 1.37 makes for a target of 1.2850. So we may expect the correction to violate the 200 DMA but stop in the vicinity of 1.27 to 1.28. |
 |
USDJPY: The USD closed the week at 93.56 after making a 94.76 last week. Wave counts indicate a sideways movement for some time to come but without ruling out a new high above 94.76. An attempt at 101 Yen remains a distinct possibility after some consolidation. First major support for USD is at 90. |
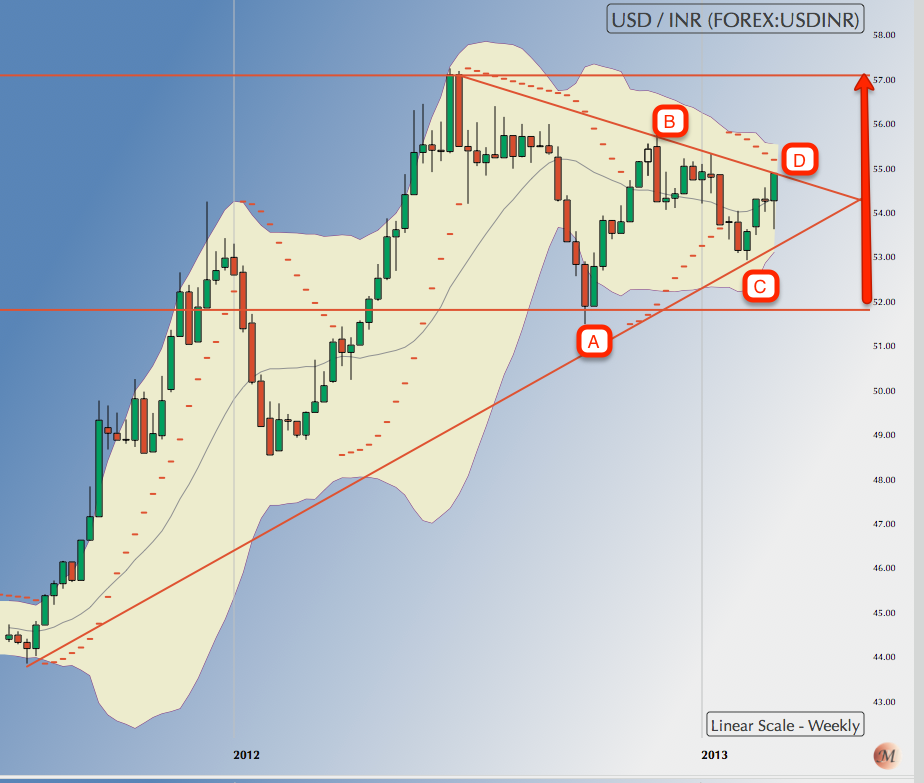 |
USDINR: The dollar closed the week at 54.90 just atop its 200 DMA at 54.65. The INR has a strong negative correlation to DXY and given the strong upward momentum in DXY, the USD could head for the previous top of INR 57.25 over the next six to eight weeks. The $ could consolidate just above its 200 DMA for a few days before testing its overhead resistance 55.50. A break above that level will be a major inflexion point for the $ in the INR market. |
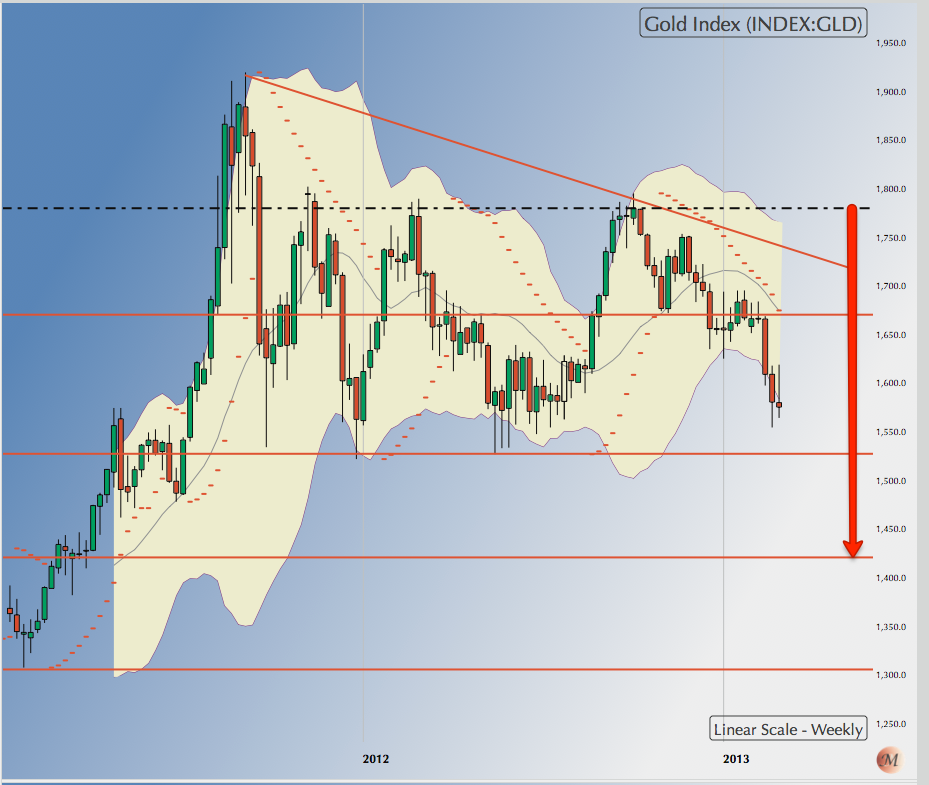 |
Gold: Gold closed the week $1572 after confirming the $1620 level as the new major overhead resistance. Gold’s next major target on the downside is now $1525. Gold could pull back from $1560 level to about $1620 level to gather steam for the attempt to take out $1525. It has plenty of time to take out $1525 before mid-May 2013. |
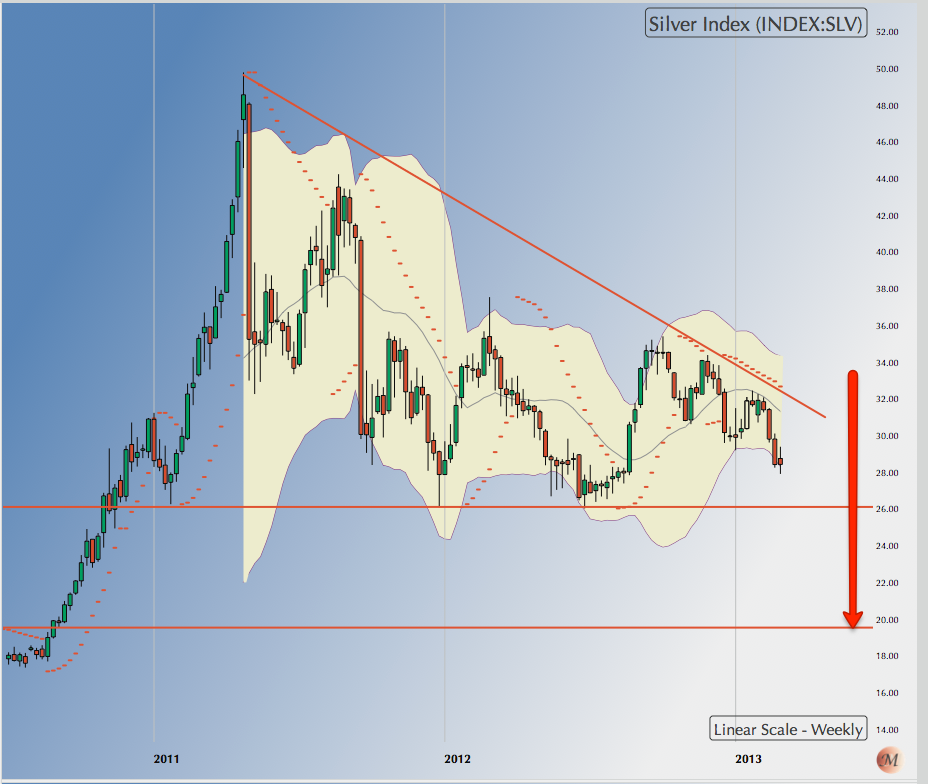 |
Silver: Silver closed the week at $28.49, just a notch below its 28.50 support. Silver’s next logical target is $28 followed by the previous low of $26. Given the characteristic low volatility in Silver over last four months my guess is that the metal is saving up a major sting in its tail. I would be very surprised if the floor of $26 holds up for silver. It could overshoot to $20 very easily and has plenty of time to get there. |
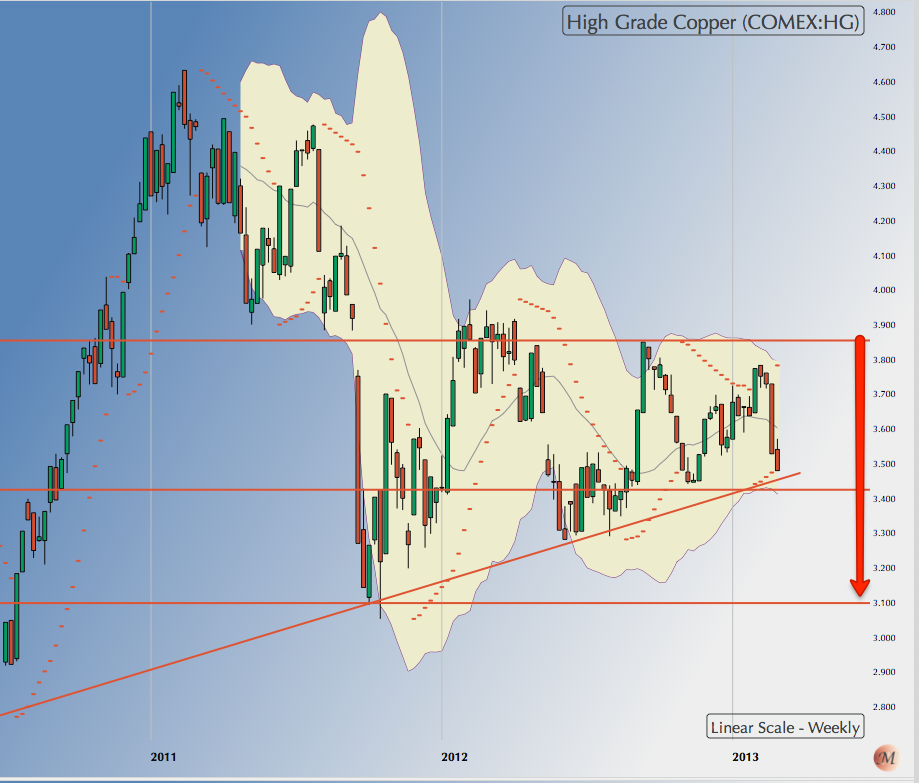 |
HG Copper: Copper closed the week at 3.501 after making a low of 3.4725. In the process it breached its 200 DMA that lies currently at 3.5580. Not that a breach was required for to confirm a bearish trend in copper. But the trend in copper is significant for the trend in industrial stocks. Copper’s next target is 3.40. The metal has multiple supports between 3.40 and 3.10. Could copper actually go all the way to 3.10? I think yes, if all the risk assets compress at the same time some time mid-May since cash flow shortages spill over asset classes. |
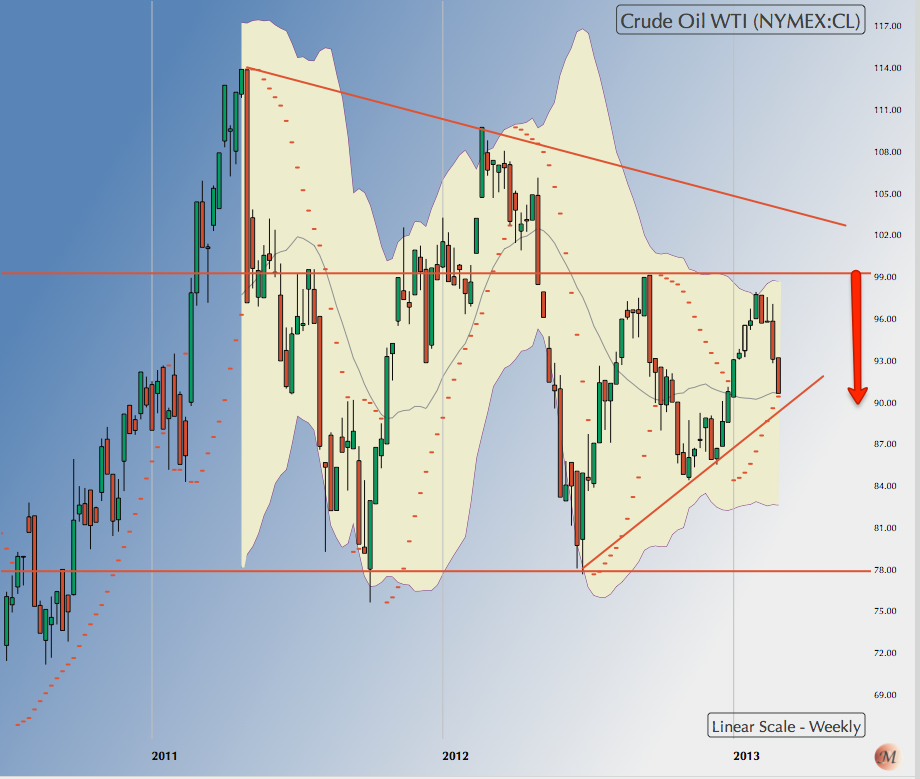 |
WTI Crude: Crude closed the week at $90.68 after nicking its 200 DMA that currently stands at 90.40. Crude is now clearly headed into the last leg of its complex correction that started 114.80 in February 2011. That could take crude to as low as $77 before this correction is over. Next logical target for crude now lies at 89.50 followed by a stronger support at 84. A pullback from the 200 DMA to the 50 DMA would give us a few clue to what follows. Crude will not escape the correction in commodities across the board. |
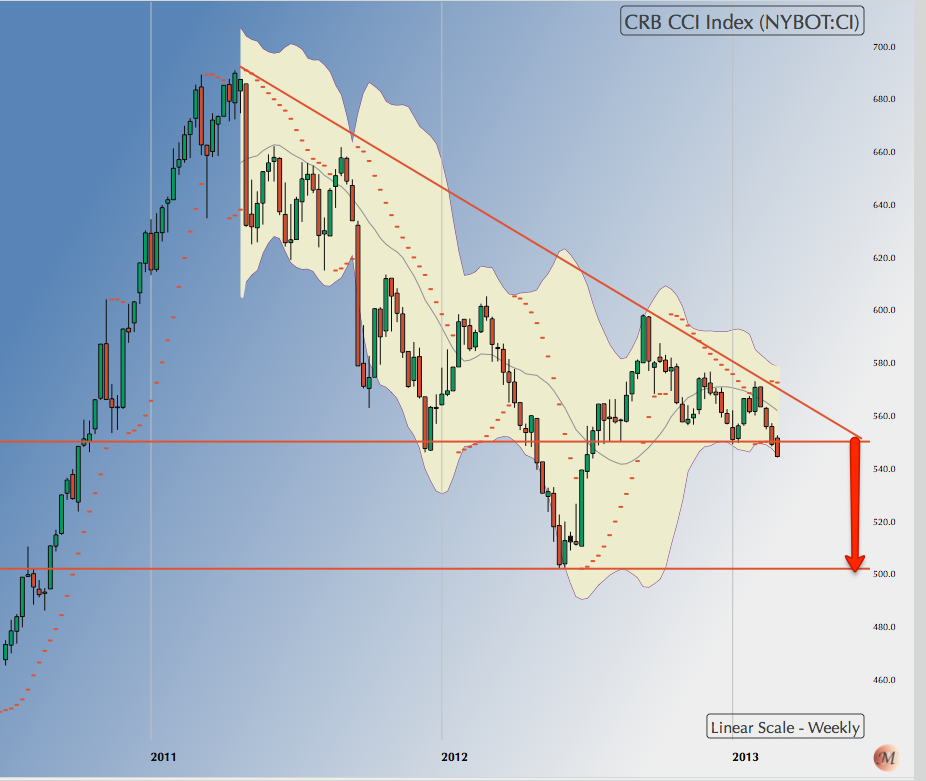 |
CRB CCI Index: Having talked about commodities in general, let’s look at the widely followed 17-commodity equal weight index. The index broke major floor at 550 to close the week at 544.6. That is a huge breakdown in commodity prices and opens the way to a drop to all the way 450. The wave counts indicate that barring pullbacks, we might get there by Mid-May. |
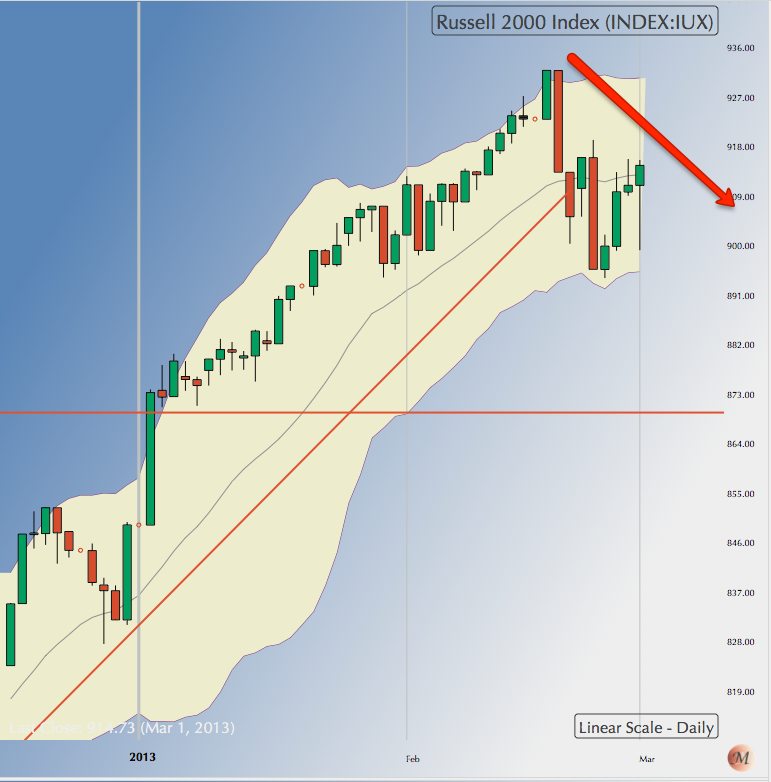 |
Russell 2000 [RUT]: RUT has been the most “frothy” of the US equity indices given the mid-cap space it represents. Corrections here can be brutal. The index has dropped from a high of 932.85 to 895.84 but the pullback has been pretty weak topping out at 915. On the intra-day charts, an intermediate correction has been triggered whose first target could be 855. Too early to call where this correction will go eventually. |
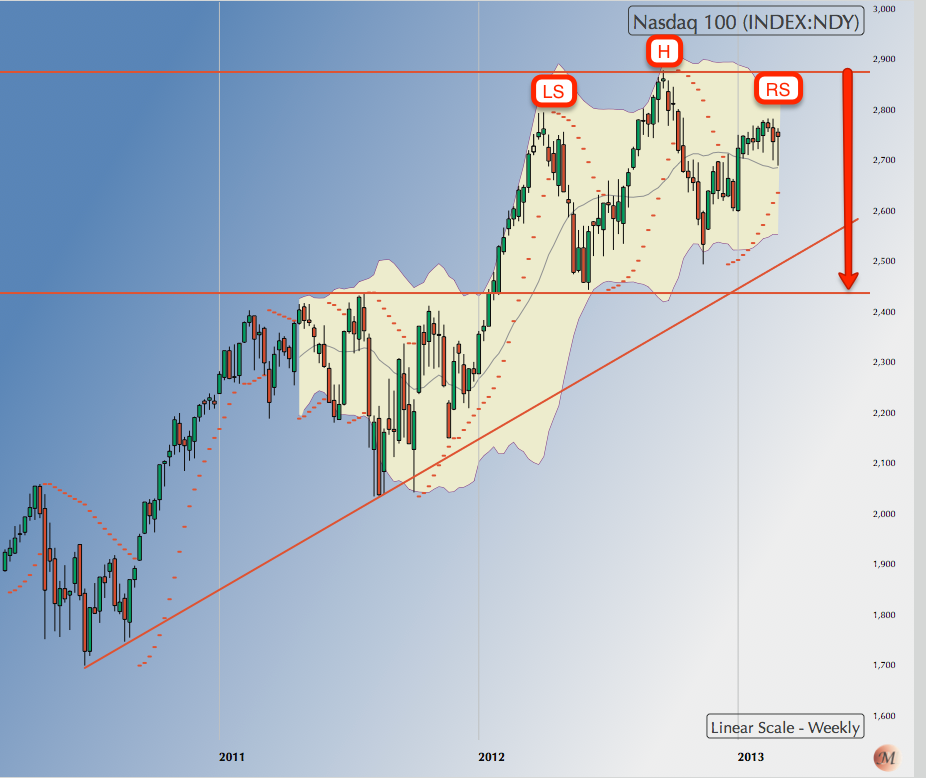 |
NASDAQ 100: The NASDAQ 100 is actively traded and closed the week at 2748, just below its 50 DMA but still well above its 200 DMA. The large inverted S-H-S on the weekly charts is ominous although unless confirmed by a breach of the neckline 2500 it really warns of correction with signaling confirmation. Nevertheless it should be noted. The point here is that NASDAQ100 confirms the onset of a correction. Next target for the index is its 200 DMA at 2678. A test of 2650 however is more significant and may follow in a week or so. |
 |
S&P 500 [SPX]: The SPX closed the week at 1518.20. On the intraday charts, SPX has clearly triggered an intermediate correction but it is too early to call what shape it will take. Next target for SPX now becomes 1460. It may well get there towards the end of next week. |
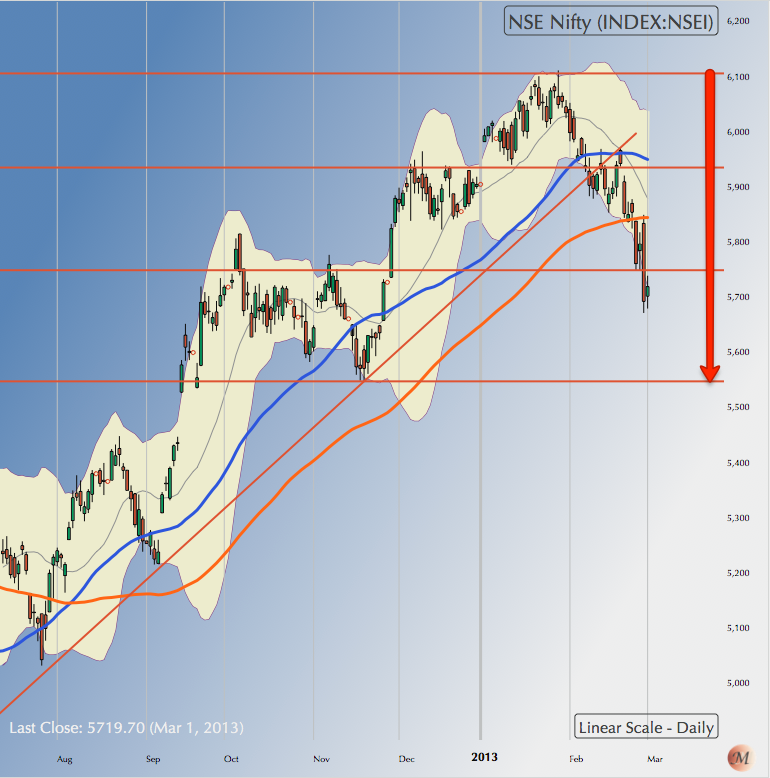 |
NSE NIFTY: The Nifty closed the week at 5719.70 after making a low of 5671.90 during the week. With the breach of 5700, Nifty has opened the way to a drop to 5550, which is also its 200 DMA. The Nifty may test this level next week. Nifty has a more solid support below its 200 DMA at 5350. A dip to that level can’t be ruled out. |
Maintain my view that long term investors should look to buy front line blue-chip stocks at their lows in this correction. It is safer to go stock by stock than look at the index which has several moving parts.
NB: These notes are just personal musings on the world market trends as a sort of reminder to me on what I thought of them at a particular point in time. They are not predictions and none should rely on them for any investment decisions.
Sonali Ranade is a trader in the international markets.