 | « Back to article | Print this article |
Long-term trends indicate that the extremely high world agricultural prices are not an aberration but will soon become the new normal, which has humongous policy implications for India's economy, says Sonali Ranade
Quietly, agricultural commodities have been inching up on world markets for quite some time and are now poised close to breakout levels over previous all-time tops.
The matter has drawn scant attention in India outside a circle of commodity traders. Long-term trends indicate that the extremely high world agricultural prices are not an aberration but will soon become the new normal.
These trends have humongous policy implications for India's economy. I am therefore putting out a commentary on the emerging price trends largely to create greater awareness about agricultural commodity markets.
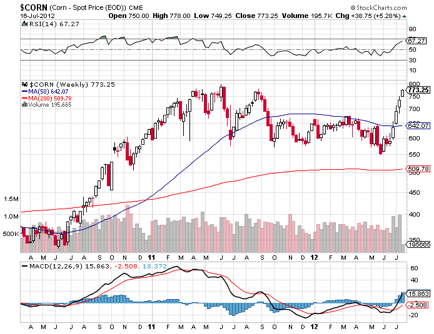 Corn [$CORN]: Corn [maize in India] began its latest bull run in February 1987 from a level of $142.45 per 5000 BU [bushels]. The first leg of the bull run peaked at $518.97 in June 1996, some nine years later.
From the peak of $519 in June 1996, corn corrected down to $185 in November 2005 in a classic A-B-C pattern over a period of roughly 10 years. The bull run we now see began from this low of $186 in November 2005 and made a high of 749.75 in July 2012. From that point, corn corrected to a low of $325in June 2010. Rallying from there, corn made a high $793 in July 2011, significantly higher than the previous all-time high at $749.75.
Corn is now poised at $755.75. The current bull run has a lot of time to run. In fact the cycle could well extend into 2015 with a few shallow corrections in between.
One can expect a breakout in corn prices over the next few weeks that is likely to be sustained over time. Watch out for corn prices. China is the world's largest importer of corn and I don't understand why we don't export the commodity at all.
Note the pickup in volumes traded as the price has surged in recent weeks.
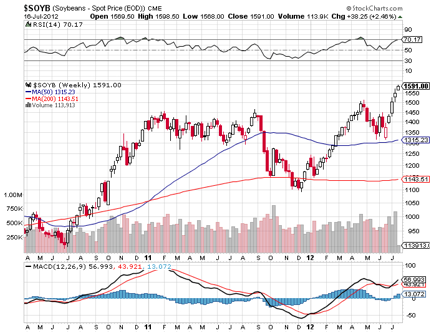 Soybeans [$SOYB]: The $SOYB long-term chart is a technician's delight and I recommend it for study to all would-be technical analysts. It is also typical of most commodity charts.
Soybeans began its bull run at $413 per 5000 BU in July 1999 and made the top of $1065 in July 2004. From there it corrected in a rather odd but very bullish manner, making a higher top in the correction but also the low of $776.25 in December 2008. From there, we are into the C part of the up move that will likely extend.
$SOYB has already made a new high of $1680 and on Monday closed at $1642, well over its previous all-time high of $1636 made in July 2008. With that breakout, we are now in uncharted territory for $SOYB. This happens very rarely in commodity markets. It is something of a once in 50 years event.
Again, note the pickup in volumes at the breakout. Expect much higher prices in the future as we are nowhere near the end of the bull run. Soya has been a huge success story in agricultural exports for India, largely due to private sector efforts. We need to replicate the model in corn and other agricultural commodities. Most of our exports of soya are to the US. With China emerging as the biggest importer we need to step up production and create a new market in China.
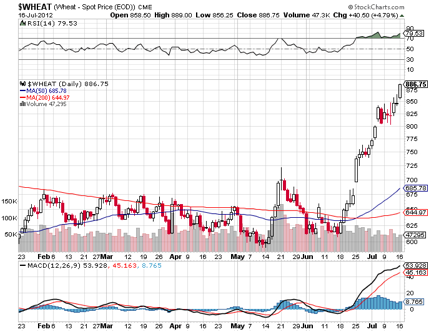 Wheat [$WHEAT]: Wheat began its current long-term bull run in June 1987 from a price level of $263.25 per 5000 BU. It made a top of $720 in April 1996 in the first leg of its run-up. From there it corrected down to $288 in March 2005 at the end of a seven-year correction that saw many lows in between.
The third leg of the bull run began from $288 in March 2005 and topped out at $1349 in February 2008, which was its all-time high. It has since corrected from the peak to a low $427.75 in June 2010 that marked the end of the correction.
We are in the wave c of C up that could extend. Wheat closed last Friday at $842, not far from $893 that was the top in wave a of C. A breakout atop that level will surely see wheat reach for its previous all-time high.
Note the volume hasn't supported a surge in wheat as in other commodities and hence the price is vulnerable to sharp corrections. Nevertheless, I am bullish on wheat as well.
Cotton [NYSE]: Not been able to locate a chart for cotton on my charting service. Will make other arrangements shortly. Meanwhile, here is a brief commentary.
Cotton is correlated to agricultural commodities but has a distinctly different time cycle from them. Cotton began its latest bull run October 2001 from a price level of $28.25. From there, the price topped at $89.25 in March 2008 at the end of the first leg of the run-up.
Cotton is actually in wave B down from there, which continues. After making a low of $42.83 in the first leg of wave B down, Cotton took off to make high of $217.77 in March 2011 and corrected down to a low of $68.55 from there.
Cotton closed last Friday at $89.26, just under its top in the A leg of the bull run.
Considering the highly irregular and violent correction in the B leg so far, making price predictions is hazardous. Nevertheless, we now into wave c of wave B and that means the price could at best consolidate around the $90 level. Cotton isn't all that bullish for the moment although like others it is also positioned at a breakout point. Best avoided for now.
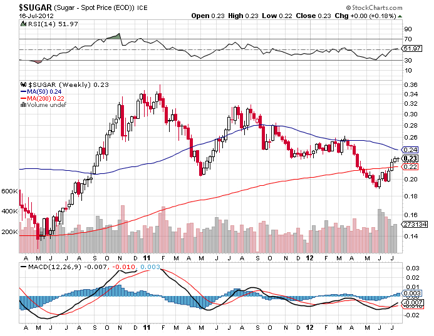 Sugar [$SUGAR]: Sugar chart is rather sweet to read. Consumers may find the price turn bitter pretty soon.
Incredibly, sugar began its bull run from a price of $2.28 in June 1985, making a top of $15.22 in December 1994 on completing wave A. In the B down, sugar made a low of $5.27 in December 2004. From that level it launched into wave C, which we now straddle.
Sugar has traversed an orderly five-wave impulse formation in wave C of which we are currently just beginning wave 5. This count can change if wave C extends as is very likely. Nevertheless, sugar is certainly bullish and the first major logical target remains $35 followed by its all time high at $45.
Note, sugar has just broken atop its 200 DMA on weekly charts with an upsurge in volumes and is headed for a golden cross. You can't argue bearish with that formation!