| « Back to article | Print this article |
It is difficult to answer this question in yes or no. Here's Dwaipayan Bose's thorough analyses
Illustration: Uttam Ghosh/Rediff.com
You may have often heard capital market experts and financial planners saying, equity is the best performing asset class in the long term. They cite examples of Sensex or Nifty return versus gold and fixed income returns over the last 3 or 5 years.
But has Sensex beaten all other asset classes across all long term time-scales?
Firstly, let us discuss how long is long term?
The definition of long term is really a matter of opinion. To some people, three years is long term and to others it is 5 to 10 years. But for most people, readers will agree, 10 years is a long time period.
Consider the period from January 1, 1999 to January 1, 2009. Was equity the best performing asset class from 1999 to 2009?
During this period, the Sensex, which we will take as the benchmark for equity returns in India, gave a compounded annual return of 12.3 per cent.
Over the same time period, your PPF account, which is one of the best long term fixed income schemes, would have given you a compounded annual return of around 9.3 per cent.
So Sensex would have beaten fixed income, but what about gold?
From 1999 to 2009, gold gave a return of 13.2 per cent. Gold beat Sensex over this investment period.
Let us take a more recent example and look at the period from January 1, 2006 to January 1, 2016.
Over this period Sensex gave a return of 10.6 per cent, comfortably beating fixed income, but gold gave a return of 11.7 per cent.
What does the above two examples tell us?
If you thought, Sensex will always give you higher returns than other asset classes then, you need to reset your expectation. But, is gold the best performing asset class in the long term?
The simple answer is, we cannot judge the relative performance of two or more asset classes based on one-off examples, as some investment bloggers tend to do. Equity and gold returns are driven by the market determined prices and therefore market conditions at any point of time will bias the results when we look at point to point returns.
At Advisorkhoj, we are not swayed by either rhetoric or perception, and our approach is always analytical and data driven. We have said a number of times in our blog that, rolling returns is the best measure of investment performance.
In this post, we will compare the rolling returns of various asset classes, over various investment horizons and try to draw useful conclusions for long term investors.
Before we get into our analysis, let us understand what rolling return is. Rolling returns are the annualised returns of the scheme taken for a specified period (rolling returns period) on every day/week/month and taken till the last day of the duration. In our analysis, we will measure rolling returns for every day in the period in consideration.
For our analysis, we have taken daily Sensex and gold prices from January 1, 1996 onwards till July 1, 2016. We will also compare the rolling returns of Sensex and gold with fixed deposit.
Let us see 10-year rolling returns of Sensex versus gold versus fixed depost from 1996 till date. In other words, we will see how much returns an investor has got over a 10 year investment horizon, by investing in Sensex, gold or FD on any day from January 1, 1996 to July 1, 2016.
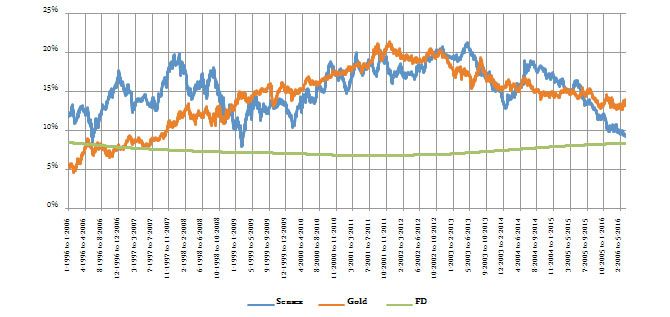
You can see that, both Sensex and gold beat FD comfortably over a 10-year investment horizon. Between Sensex and gold, as you can see in the chart above, there were times when Sensex beat gold, there were times when gold beat Sensex and for long periods of time Sensex and gold returns were closely matched over a 10 year investment horizon.
However, you can see that, when Sensex beat gold, it outperformed by a bigger margin than when gold beat Sensex. One important conclusion we can draw from the above chart is that, asset allocation is important, if you are looking for long term investment returns.
We have discussed earlier that, the definition of long term is really a matter of opinion. Let us look at the 5-year rolling returns of these three asset classes; in other words, how much returns an investor has got over a 5-year investment horizon, by investing in Sensex, gold or FD on any day from January 1, 1996 to July 1, 2016.
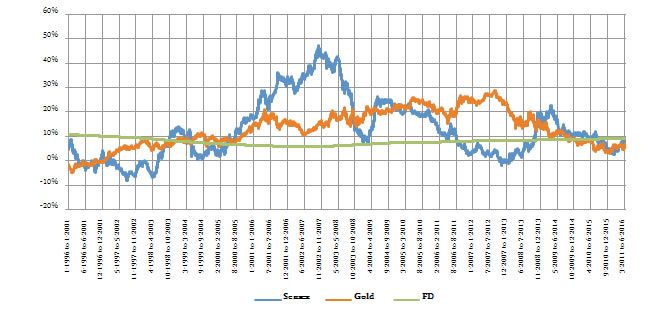
If you compare 5-year rolling returns chart with the 10-year rolling returns, you can see that Sensex is the more volatile asset class as the investment horizon shortens. You can also see that, the performance gap between the Sensex and gold widens (either Sensex beating gold or vice versa), when we shorten the investment horizon.
But look at the minimum and maximum rolling returns of Sensex versus gold. The minimum rolling returns of Sensex and gold are -8 per cent and -5 per cent respectively, whereas the maximum rolling returns of Sensex and gold are 47 per cent and 29 per cent respectively.
Therefore, while the worst case scenarios of Sensex and gold were separated by only 3 per cent, in the best case scenario, Sensex outperformed gold by a huge margin (18 per cent).
In other words, the possibility of getting high returns from equity is much more than other asset classes. The risk return trade-off of equity versus other asset classes over a long investment horizon makes it a more attractive investment option for investors with high risk appetite.
Let us spend some more time on risk return profile of these asset classes.
If you thought gold is a safe asset, look at the chart above again. Gold gave lower returns than fixed deposit even over a 5-year investment horizon, a number of times over the last 20 years.
In fact in the late '90s and early 2000, gold even gave negative returns over a 5-year investment horizon, as you can see in the chart above.
Many of us have the perception that in times of global financial crisis, investors shift to gold. Precious metals' price response to financial crisis does not always support this perception.
For example, during the Asian currency crisis, investors shifted their assets to US Treasury Bonds instead of gold. However, in the financial recession of 2008, gold price did rise. When equity markets fell in 2015 due to China and Eurozone concerns, gold also fell about 8 per cent, as investors shifted to US Treasuries again.
As far as equity is concerned, we have discussed a number of times in our blog that it is the most volatile asset class. Retail investors, who think that, equities will always give higher returns than fixed deposits over a three to five year horizon, need to correct their perception.
You can see that, while Sensex beat fixed deposits most of time in terms of 5-year rolling returns, there were times when Sensex return was lower than FD even over a five-year investment horizon. However, if you have a longer term investment horizon, the probability of Sensex beating risk free returns increases substantially.
As discussed earlier, over a 10-year investment horizon, Sensex always beat fixed deposits.
Let us now discuss the relevance of Sensex for retail equity investors.
Though we often use Sensex or Nifty as a proxy for the equity market in India, as a retail investor you should understand the practical relevance of Sensex or Nifty as far as your equity portfolio is concerned.
While your portfolio movement can be directionally aligned with Sensex movement, your portfolio returns can be very different from Sensex returns.
Sensex is made up of the 30 largest market capitalisations of stocks in the market. Do you own all the 30 Sensex stocks, in the proportion of their weights in the Sensex?
If not, your portfolio returns will be different from Sensex returns. In fact, diversified equity mutual funds have historically beaten Sensex returns over different time-scales.
The chart below shows the average trailing returns of diversified equity funds and the Sensex over different time scales.

You can see that, diversified equity funds on an average beat Sensex by 3–8 per cent across different time-scales. Please note that the chart above shows the average diversified equity fund returns. Top performing funds beat average diversified equity fund returns by a further 7–12 per cent.
If you compare the top performing diversified equity mutual funds' returns with Sensex, the former's outperformance is quite huge.
Conclusion
Let us end with the question asked at the beginning of this post.
Is equity the best performing asset class in the long term? We shared with you, the results of our analysis of performance of different asset classes over a 5- and 10-year investment horizons.
There were times when the Sensex outperformed gold and vice versa, and there also long periods of time, when gold and Sensex rolling returns were closely matched.
At Advisorkhoj, our take on the asset class question is that different asset classes serve different purpose.
Fixed income provides safety of capital and stability of income.
Gold is a good long term hedge against inflation and as an asset class is less volatile than equity.
Equity investment is much more complicated than investing in fixed income or gold because there is a vast universe of stocks with different growth potentials. By relying on the expertise of good mutual fund managers, you can use equity to create wealth over a long investment horizon.
Courtesy: