 | « Back to article | Print this article |
The only matter for speculation is if the markets will make a new high before turning down or simply slip unceremoniously anytime now, says Sonali Ranade
The world markets are not in sync, either in terms of geography or asset classes. That's not been the normal trend for many years. Usually such divergences presage a change in basic long-term trends. Investors should treat these divergences as cautionary signals in their respective markets that the uptrends [or downtrends] they have long assumed in effect are about to alter.
Most major markets are fairly close to their all-time highs following uptrend in prices that started in March 2009. We are thus in mature bull markets which are fairly late in their fifth wave up. The only matter for speculation is if the markets will make a new high before turning down or simply slip unceremoniously anytime now.
The case for new highs is fairly strong. First, Asia, in particular China and Japan, are breaking new ground and making new highs after having come off what looks like a bottom. Second, European equity markets, particularly DAX, has broken into new and higher territory. Last, the US equity markets, while correcting since December 18, have not yet violated a level that would negate the rally in prices that began on November 16.
From 1375 to1390 on the SPX is a level that markets need to hold through the uncertainties of the fiscal cliff. This represents both the 200 DMA and significant support levels. A violation of the 200 DMA on a closing basis would be a clear sell signal. Investors should use stop losses here even while expecting the rally to resume once the fiscal cliff uncertainty is out of the way.
Commodity markets appear to have launched on another cycle of correction towards new lows that may last one to two years. There will be intermediate rallies of course, but within the overall bear markets that continue.
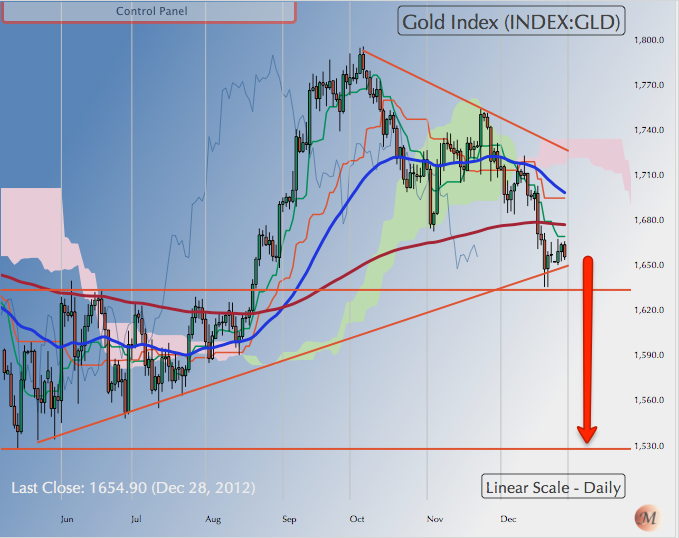 Gold: As the chart shows, gold has broken below both its 200 and 50 DMAs and is supported by the lower channel of a trading range that guided it up since May 16. Gold closed last week at $1655.90.
Gold can find support on the way down at $1630. Some support also exists at 1590. However, given the tame break below $1660, eventually, a retest of $1525 is almost certainly in the cards in the next few weeks if not months.
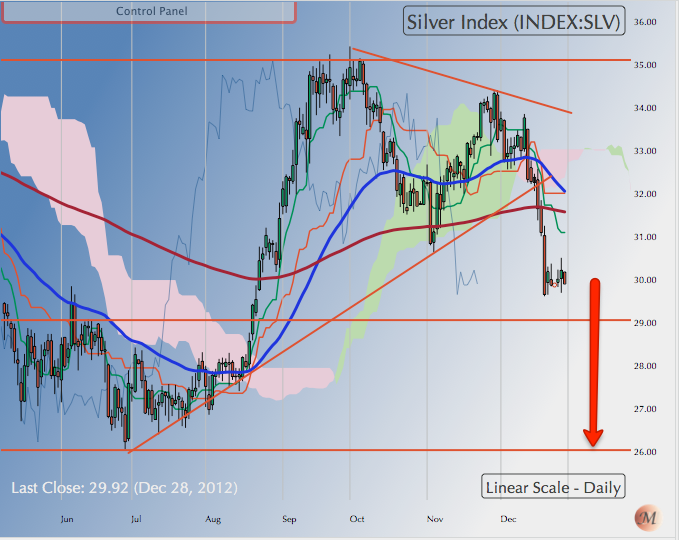 Silver: Silver closed last week at $29.75, well below its first overhead resistance $30.60 and its 50 and 200 DMAs.
Silver could bob along testing its overhead resistance at $31 before eventually moving down to retest $26. On the other hand, there is nothing to rule out a sudden drop $28.5, which is the only significant support between now, and $26.
 WTI Crude: Crude showed surprising resilience in the wake of weakness in commodity markets by rallying almost to its 200 DMA now positioned at $92. It closed the week at 90.80, well below its 200 DMA. Crude has a strong overhead resistance at $93. A rally past that level would negate the analysis given here.
Crude appears to be on course for a retest of $77.50. However, it appears to be in no particular hurry to get there. Nevertheless, the rally in prices now underway may already have terminated or will be terminated by the 200 DMA.
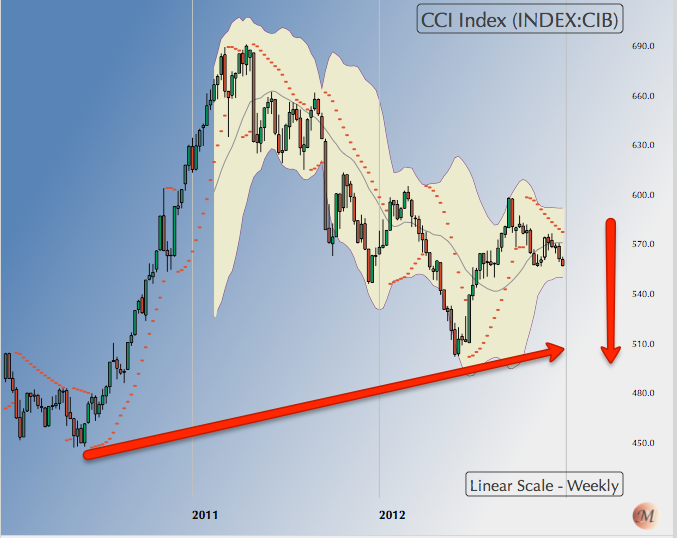 CCI Index: The graph above is the weekly chart of CCI, the Reuters equal weight index of 17 commodities and is given here to lend perspective to what's happening in the general market for commodities.
The index went into a long-term correction starting April 2011. It made a low of 500 in May 2012 after the high of 692. After the low of 500, the index could rally only up to 600 before turning down once more. It now is firmly on a downtrend for a retest 500.
A break below the support of 546, imminent any day now, will accelerate the fall.
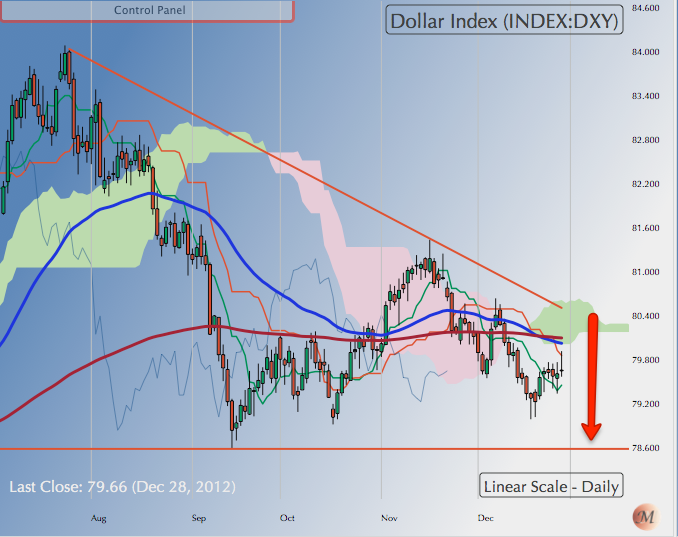 US Dollar Index [DXY]: USD Index closed the week at 79.785, just below its 50 DMA at 80.20.
DXY continues to be an intermediate down trend with an eventual target of 78.60. However, it is in a counter-trend rally from the low of 79 on December 19 that may terminate either at the 50 or the 200 DMA; the latter being at 80.90.
A more likely terminating point for the counter-trend rally is the down-sloping top of the trading channel in the 80.40 region in case the index tops its 50 DMA at 80.20.
 EUR/USD: Euro$ broke-out above 1.3170 to make a high of 1.33 on December 19. It has since pulled in to test the new support at 1.3170.
The correction can continue for a couple of weeks and may even test the deeper support 1.3050 before continuing with the rally.
The long-term uptrend in the Euro$ remains firmly intact even if 1.3050 is tested over the next few weeks.
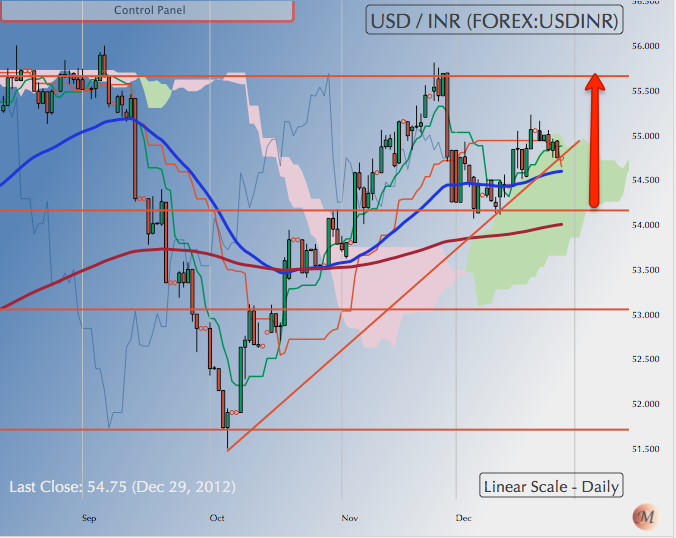 $-INR: The $ closed at 54.75 well above both the 50 and 200 DMAs. Note also that the 50 DMA has just crossed over the 200 DMA, signaling bullishness in the $ vs INR.
The $ is poised well above the floor of INR 54 and made a high of 55.28 before correcting for a few days.
In the next week or two, the $ is most likely to mount a fresh assault on the important overhead resistance of INR 55.60. If it turns down decisively from there, it will confirm an intermediate downtrend against the INR. On the other hand, on surpassing the 55.60 level the $ will almost certainly test the previous high of 57.30.
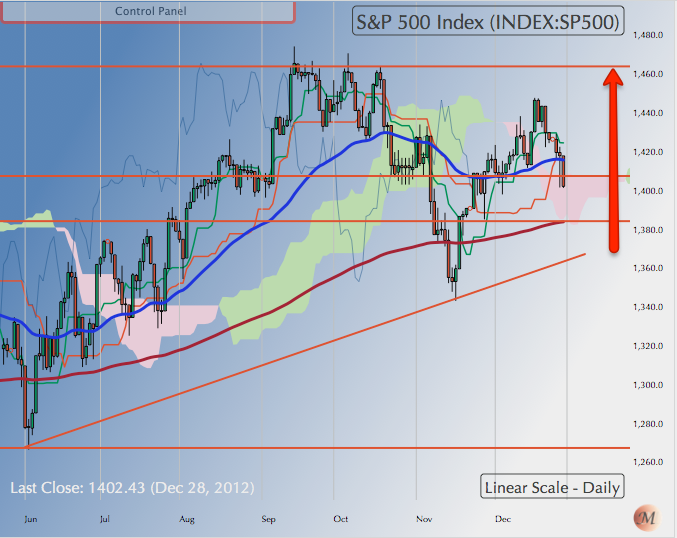 S&P 500 [SPX]: Face the issue squarely. Recognise that the market could already have terminated its grand bull run from March 2009 to the high of 1474 on September 14. SPX closed the week at 1402, a notch below its 50 DMA.
The point I am making is that we are into a very mature bull markets that is ripe for intermediate term correction. So it is not rare to find technical breakdowns in the uptrend in the wave iv of wave 5 of wave V. Which probably is what last week's close at 1402 signifies.
That said, bull markets don't end in a whimper although they obviously can. So I see another leg up that could retest 1474. But be prepared with stop losses just below 1380 just in case.
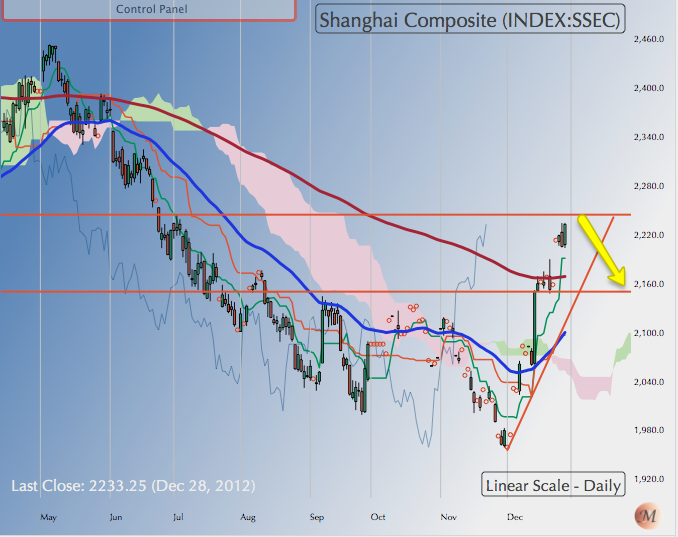 Shanghai Composite: Shanghai, and Nikkei 225 as well, illustrate the fact that not all the world's equity markets are moving in sync, a phenomenon not very rare but equally not very common either.
Shanghai Comp closed the week at 2233, well above its 200 and 50 DMA. The break atop the 200 DMA followed a few days of consolidation above 2140, which was the first "breakout" point. The point 2233 represents a significant overhead resistance. Cutting through it will open the way to 2500.
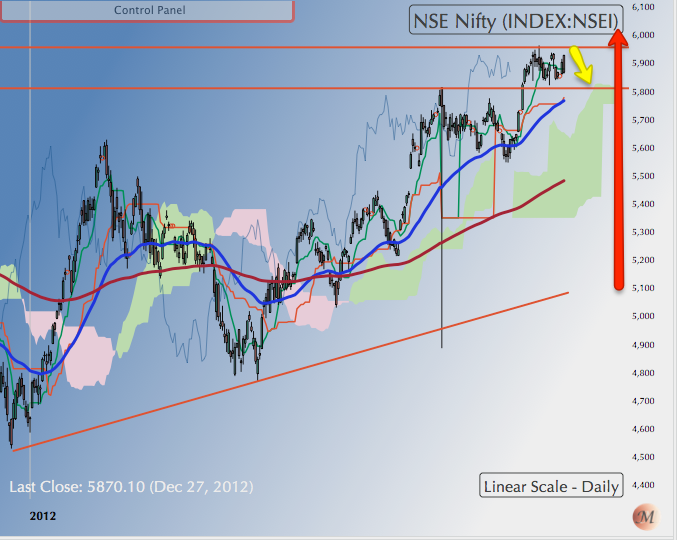 NIFTY: NIFTY appears to be consolidating just above 5830 before making another attempt to clear the 5950 overhead resistance. The index closed last week at 5908.
So far NIFTY's price action is consistent with two alternative scenarios. The first scenario could be that we are in broad wave III down that began at 6348 and possibly terminated at 4544. The present pullback is therefore wave 4 and will be followed by a wave 5 beginning sometime in February end but could start anytime now.
The second postulates that correction to the last major bull run ended in March 2009 and the run-up we have had since then is wave I of new bull market cycle. Wave II of this new cycle could have then ended at 4543 on December 19, putting us in wave III of the new bull cycle.
Both scenarios are consistent with a correction in February/March that retests the lows this market can reach. And that scenario ties in with what could be a wave II correction in the US and world markets.
Either way it is good to buying your favoured blue chips at the dips with stops just below 5800 should things go wrong.
Note, it will be very hard to tell the difference between wave V of a bear market down and wave II new bull market up. The difference in fact may be just academic at this point though it will make a crucial difference as we get into the later stages of a bull market.
NB: These notes are just personal musings on the world market trends as a sort of reminder to me on what I thought of them at a particular point in time. They are not predictions and none should rely on them for any investment decisions.
Sonali Ranade is a trader in the international markets