 | « Back to article | Print this article |
The crack in the equity markets is serious and portends a deeper correction ahead. The markets will almost certainly attempt to complete the interrupted up move next week, says Sonali Ranade
Yields on 10-year US Treasury Notes spiked up to 254 basis points during the week. The near panic sell off in the bond markets roiled asset prices across all classes, from commodities to equities. The spike in yields was not unexpected. This blog has pointed out the upturn underway for weeks now. But the spike above the resistance of 230 basis points was a surprise. The spike will almost certainly not sustain, and yields will return to more benign levels.
Commodities, already in the midst of a long-term correction, took the spike badly. Gold and silver made new lows and other commodities, including crude, moved lower. The correction in commodities is far from over even as we may expect a modest pullback over the next few weeks as the panic in bond markets subsides.
Equity markets took the spike on the chin, lurching down quite sharply in the middle of what should have been a reactive move up. The crack in the equity markets is serious and portends a deeper correction ahead. The markets will almost certainly attempt to complete the interrupted up move next week. But it is hard to say if the pullback will be sufficient to reach the previous high let alone make a new top.
As mentioned last week, the up move under way, and interrupted rudely on Thursday and Friday by the spike, is probably the last one up. It has about half of A-B-C to go depending on how you count it. If it fails to make previous top we are into a fairly long intermediate down trend already. Exit even at a loss if you haven’t done so already.
Investors in China and India have interesting buying opportunities coming up in their current corrections. There will be no dearth of money-making opportunities. So take your profits where you have them.
Yield on 100-Year USTs: In a move that caught most market participants by surprise, the yield on 10-year US treasury notes spiked up to 254 basis points. I have been warning about the interest rate cycle having reversed for some weeks but did not expect such a sharp spike above 230 bps. The resultant turmoil in the bond markets affected all asset classes from commodities to equities. I think the spike is over done and the bond markets over sold. Expect the yields to return to mean around 220 bps as the panic subsides. On the other hand, the spike has put all on notice that the interest rate cycle has turned for some years to come. Bond markets will continue to sell off though not as dramatically as last week. The rotation out of bonds may have just begun. Where will the investment surplus go from there is the Trillion Dollar question?
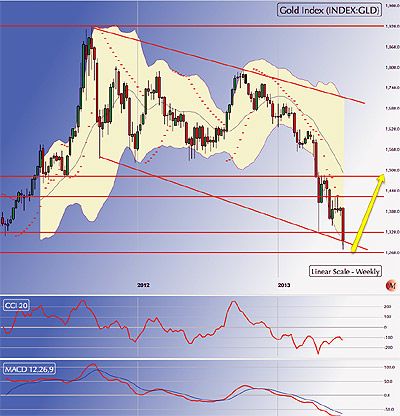 Gold: Gold closed the week at $1292 after making a low of $1275.40. Gold could test $1260 early next week but is unlikely to breach that support. Instead it is more likely to stage a significant bear rally towards $1550 as mentioned previously. The drop towards 1260 will not alter that scenario. The dip is a short term buying opportunity.
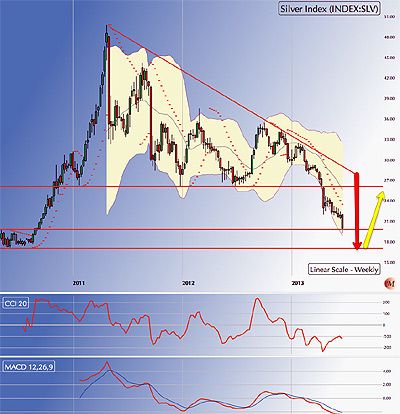 Silver: Silver finally broke through the $20 support as anticipated. It closed the week $19.959 after having made a low of $19.31. Unlike gold, the wave count in silver suggests the down draft in silver is far from over. The next support after $20 lies at $15.60. It is possible that silver will test that support over the next few weeks before staging a short-term recovery. I don’t think $20 support will hold for long.
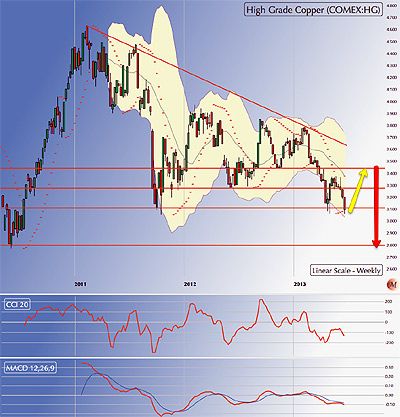 HG Copper: Copper closed the week at $3.0955 after making a low of 3.019. The metal could test 3.00 early next week but expect a short-term reactive bounce from there to the 3.25 region. The long-term down draft in copper isn’t over yet.
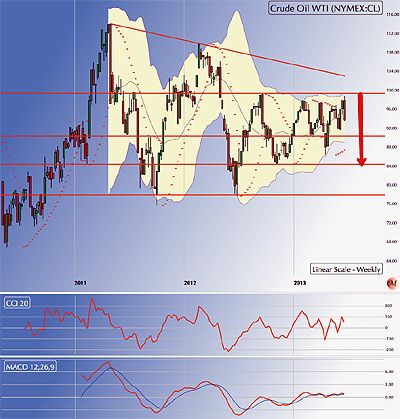 WTI Crude: True to form, WTI Crude spiked briefly above $98 to create a false bullish flag before closing the week at $93.69 after making a low of $93.12. Note, crude closed below its 50 DMA at $94 but well above its 200 DMA at $92.3. Wave counts suggest the down draft in crude should continue towards $84. However, crude price behaviour, and its tendency to shoot for the top end of the trading range at the slightest pretext, suggests an oversold commodity. Expect erratic price movements but a drift down to $84 eventually is on the table.
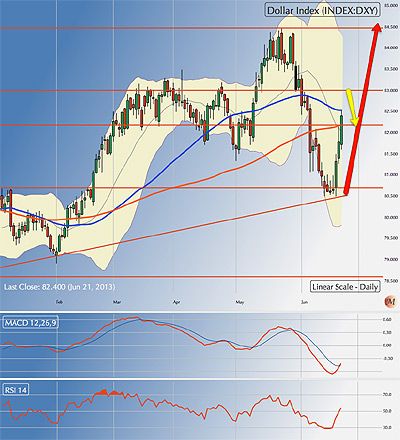 US Dollar [DXY]: As expected in this blog, the dollar staged a sharp rally from 80.50 levels to close the week near its highs at 82.517, a wee bit below its 50 DMA at 82.60 but well above its 200 DMA at 81.10. The dollar could pull back to 81 level over the next week as it consolidates for a eventual move up and beyond the previous high 84.6. Continue to be bullish on DXY for the long-term – in any case till the end of 2013.
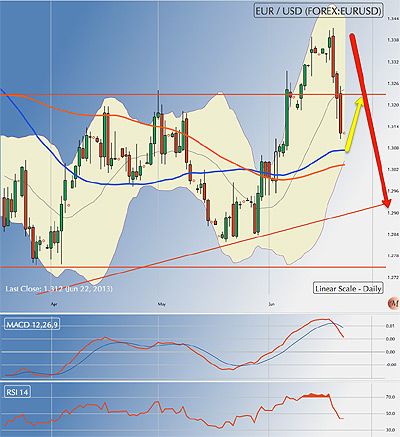 EURUSD: EurUsd closed the week 1.312, well above its 50 and 200 DMAs both of which are currently positioned 1.3072. The EurUsd spike to 1.34 above 1.32 came as surprise. The pair continues to trace out a complex correction from the recent top of 1.37. EurUsd may retest resistance at 1.32 early next week before drifting down to 1.30 level. Not bullish on the pair.
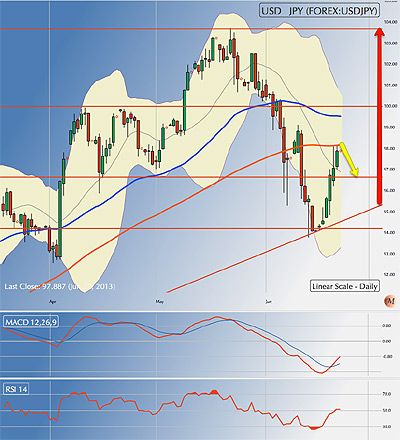 USDJPY: As expected here, UsdJpy staged a sharp rally from rally trend line at 94 to 98.50, which is also the pair’s 200 DMA. The bounce from 94 has been fast and furious and the dollar needs to consolidate a bit between 95.50 and 98 before moving up towards its previous top of 103 yen. The currency markets don’t suggest Abenomics has failed – yet.
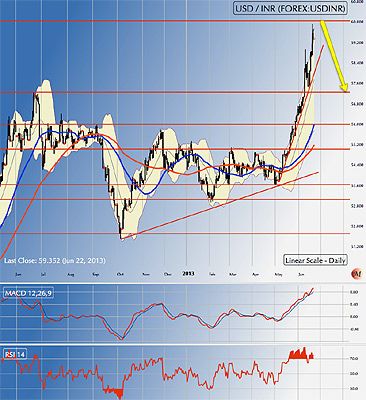 USDINR: UsdInr made another all-time high of 59.975 during the week before closing at 59.27. With the new top at INR 60, the dollar has emphatically validated my long-term wave count for the dollar in the INR market. In the short-term, the spike in the dollar is grossly over done and the dollar needs to consolidate above 57 [possibly even 56] before making any fresh move for a new high. Equally, in the long-term, the dollar hasn’t finished its up-move against the INR. There will be new highs after some consolidation.
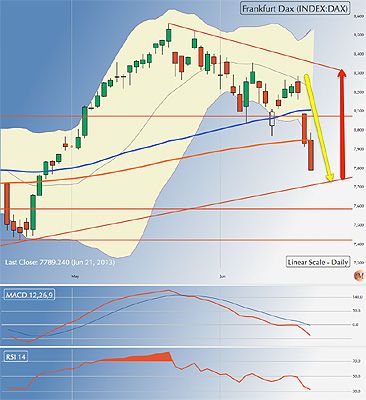 DAX: I had expected a bounce in the DAX from its 200 DMA currently positioned at 7800. [The chart shows 50 DMA in blue and 100 DMA in red.] The index made a low of 7789.24 and closed there. The current rally’s support trend line lies at 7450 and the index is unlikely to breach that level in this fall anyway. However, the wave counts now suggest that DAX may, repeat may, have commenced an intermediate correction from its recent top of 8434 on May 22. DAX is positioned for fairly sharp A-B-C rally from the 7750 region that will aim for the previous top. Whether it gets there or not depends on how much short covering the pullback triggers. Note in previous such situations the distance covered by just the A-B-C leg up has exceeded the downdraft of a full 5-part impulse wave down. So don’t rule out a double top if not a new high.
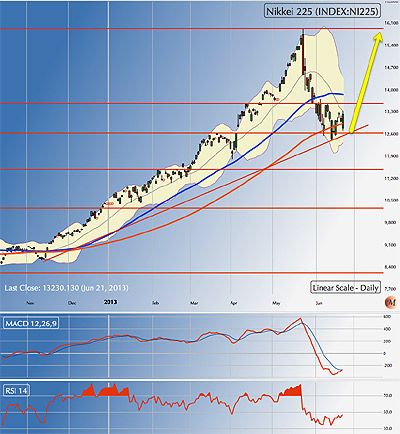 NEKKEI 225: Nikkei bounced smartly from its support at 12433 closing the week at 13230, well below its 50 DMA at 13818. Wave counts suggest, Nikkei needs to consolidate for a while above 12400 and below 13900 before making a fresh bid for a new high. A break above its 50 DMA will signal this outcome. As the case with DAX expect a rally from here but can’t be sure if a new high will be made. All that can be said is that the downdraft is over for now and there is space for a new high.
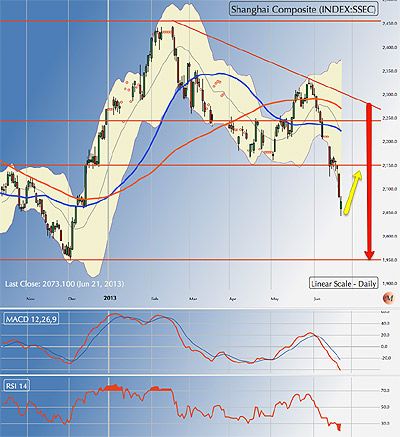 Shanghai: As expected here, Shanghai continued its downtrend oblivious to what’s happening in the rest of the world. Or may be not. Shanghai closed the week at 2073 after making a low of 2042.88. Weeks ago I had mentioned that Shanghai was likely to do a 100 pc retracement of its rally from 1950 to 2450. It is well on the way to retest 1950. Again this is China. Don’t be too sure 1950 will hold but I would nibble at blue chips there for the long haul. China Telecoms hit 52 week lows and are as good a bet as any in the world. Good stocks to look at.
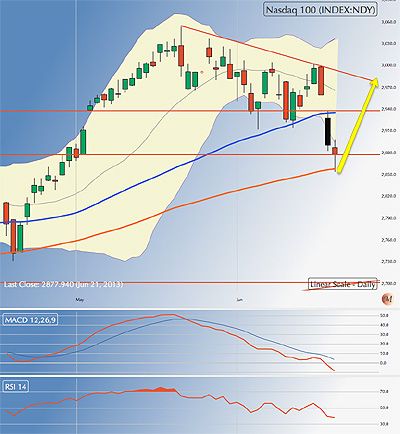 NASDAQ 100: The Nasdaq 100 did the expected things till the Wednesday of this week testing support at 50 DMA just above the gap at 2937. Then it surprised on Thursday and Friday by not only giving away the gap to bears but also cracking through the 50 DMA to close the week at 2877 after making a low of 2853, which is an important support. Net-net, we have an impulse wave down from the top of 3055 and then some. 200 DMA lies at 2800 near the rally’s trend line up. And there is space and time for an A-B-C pull back to the previous top. As I mentioned, it is the structure of the rally from the low of 2900 on 12/06/13 that is crucial in determining if the pull back gives a new high. We had a high of 3000 from there and then a surprise new low of 2860. Things don’t look good for a new high. But you never know. Expect a rally some time next week that at least makes a fair bid at the previous top of 3055.
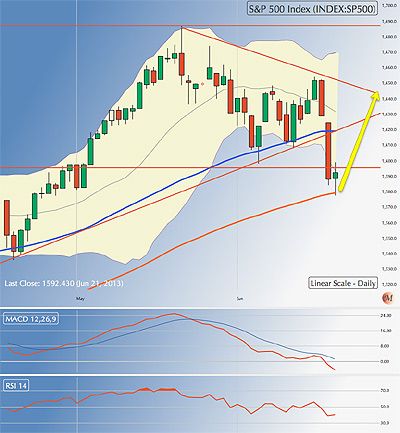 SPX: The wave structure of DAX, Nasdaq100 and SPX from their recent tops is analogous wave for wave though the duration and distance covered are slightly different. What applies to DAX and NASDAQ 100 applies to SPX as well. Namely we have an impulse wave down spanning from the top of 1685 to 1610 that tested the 50 DMA and then A-B-C of which B collapsed and closed the week 1592 after making a low of 1577.70. The collapsing B took out both the 50 DMA as well as the rally’s support trend line. The support of 1600 top was also violated.
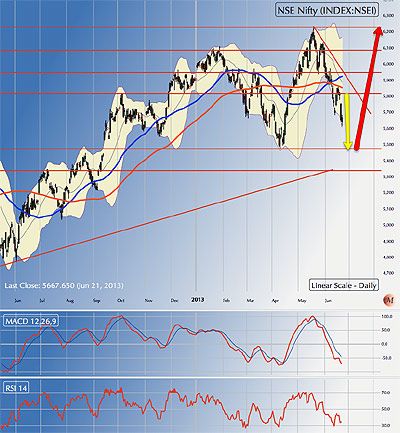 NSE NIFTY: Nifty closed the week at 5667.65 well below both its 50 and 200 DMAs. Its closest support lies at 5600, followed by more robust support at 5500 and 5400. Nifty is on C wave down of which it has just completed half. The index could take support at 5600 early next week and rally towards 5800 along with the rest of the world markets. But that would be a reactive move up to be followed by another A-B-C leg down that is likely to retest 5400 support eventually. In the long-term, so long as 5400 holds, there is no threat of a collapse in Nifty. Long-term investors should look for buying opportunities in blue chip stocks in the current fall.
NB: These notes are just personal musings on the world market trends as a sort of reminder to me on what I thought of them at a particular point in time. They are not predictions and none should rely on them for any investment decisions.
Sonali Ranade is a trader in the international markets