 | « Back to article | Print this article |
The US equity market made a new closing high of 1472.12 on the S&P 500 index on October 10. Other markets around the world made new highs as well. Some of them are listed below:
|
Market |
Index |
March 2009 Low |
New or recent high |
|
US |
S&P 500 |
667 |
1472 |
|
UK |
FTSE 100 |
3461 |
6101 |
|
Germany |
DAX |
3692 |
7666 |
|
Japan |
Nikkei 225 |
7028 |
10830 |
|
China |
Shanghai Comp |
1722 |
2296 |
The last two Asian markets are just coming off all-time lows and in the very early stages of what could be major rallies.
While there will be the usual corrections, there is nothing on the charts to show that the rally in world equities is about to end. On the other hand, the bull market in the US and EU equities is now in its fifth year. At some point in the next few weeks or months we will see a fairly significant correction. That said, for the moments the markets are in the hands of the bulls.
The dollar may be nearing the end of its correction from its recent top of 84 on the DXY Index. It had a target of 77.50 for this correction that it might fulfill in the next two weeks. Expect sharp rally in the dollar thereafter.
Commodities continue in the long-term downtrend but show signs of nearing the end of their correction in terms of time and price. Some may have already put in a bottom.
Overall, world equity markets are no longer in sync. Each market presents its own risk reward profile. For the US markets, it may be time to take some profits off the table. In others corrections may be used to buy into them.
The Indian markets are poised on a knife's edge testing the pivotal level of 5950, this time from the topside. Should the level hold, expect further rally to the topside. Should 5950 give way, a sharp drop to the long-term trend line could follow. So keep stop-losses handy till the market rallies to the upside from 5950. The point could be tested several times.
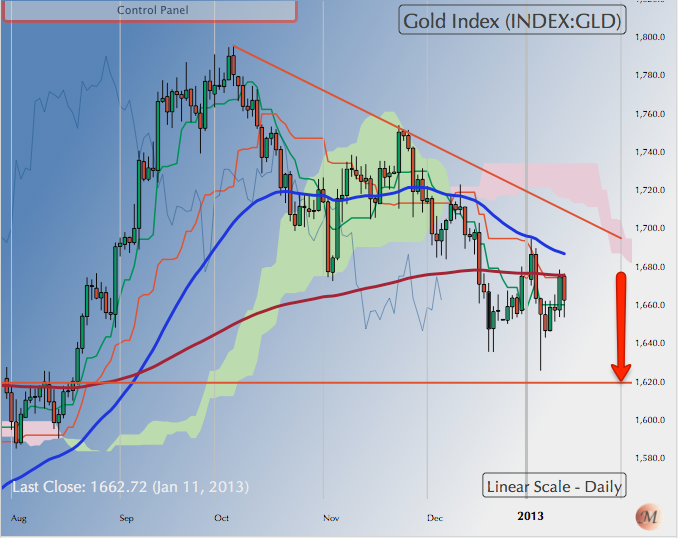 Gold: Gold closed the week at $1660.60, after turning down from its 200 DMA on the chart above.
Gold continues its bearish trend down. It could test $1620 over the next two weeks before rallying modestly in a corrective move upwards. Expect gold to range between 1620 and its 200 DMA over the next leg of it continuing correction.
Copper: Silver closed the week at $30.41. It continues in a downtrend and could drift down to $28 over the next two weeks before a corrective rally.
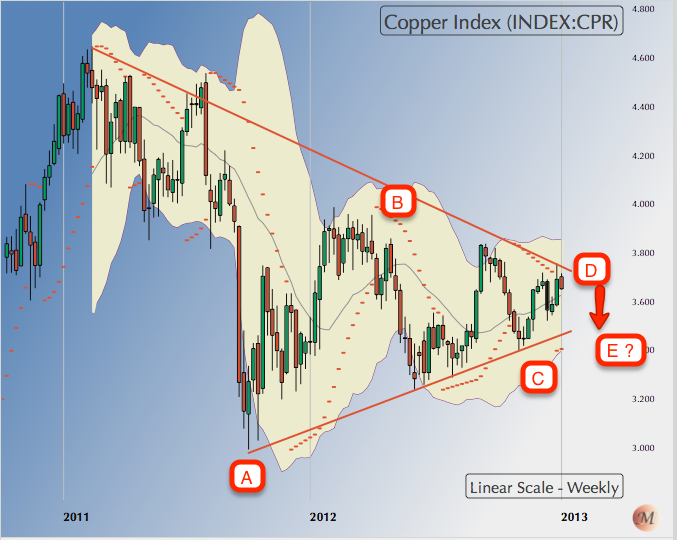 Copper presents a more interesting picture in the metal sector. It has been triangulating from the top of 4.6 hit in February 2011. Note the downtrends in other metals such at gold and silver can also be similarly analysed though the case for such a model in their case is much weaker.
The above 5-step triangulation would suggest that copper is nearing the end of its correction. The next dip down towards point E on the charts may not go all the way to the trend line. Copper bears close monitoring over the next two to three weeks.
WTI Crude: Crude closed the week at $93.56 well above its 200 DMA and its resistance at $93.
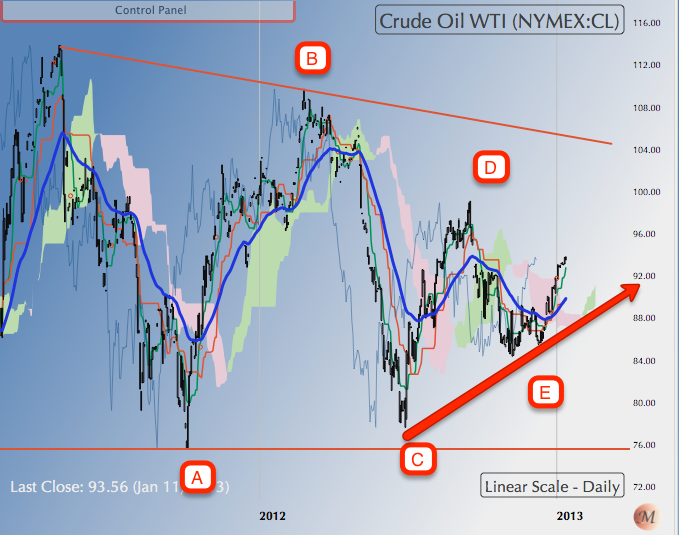 Crude can also be seen triangulating from its top at $114 in April 2011. One possible count for crude is shown above which indicates crude could have ended its correction at point E already.
If crude sustains over $93, it will confirm the above scenario. If it falls back below $93, then that could be the new point D and we could for the $85/86 region once again. In terms of time, the charts favour another dip before crude moves out of the triangle. However, the sequence of higher bottoms since point C cannot be ignored.
US Dollar Index: The dollar made some fairly deceptive moves above the down-sloping trend line but fell back to end the week at 79.61.
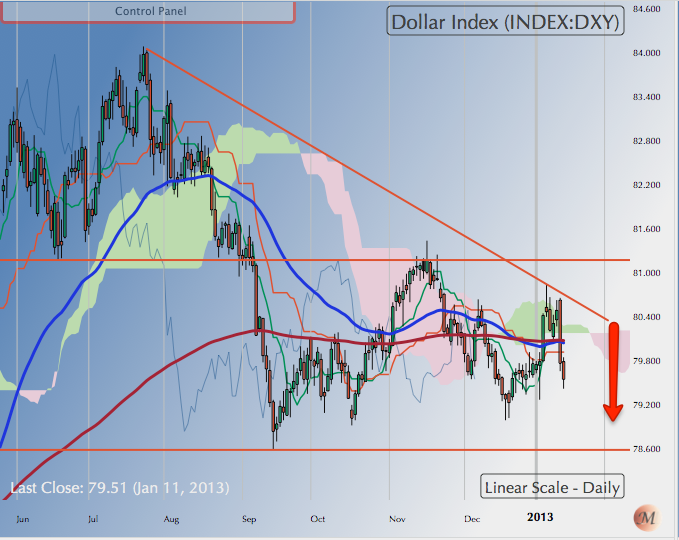 DXY had a target of 76.50 for this correction. It hasn't fallen below 78.60 from the top of 84.25. DXY could test 78.50 over the next week or two. However, we are fairly close to the end of the correction in the DXY. Dips to 78.50 could be used for buying the dollar.
In terms of time, the sideways movement in the dollar could extend towards the middle of March. Price-wise we would be pretty much done once it hits 78.50 assuming it gets there!
10-Year US Treasury yield: EURUSD made a high of 1.3365 after correcting down to 1.3000. The euro could begin another bout of correction from its high of 1.3365. But it would be a sideways correction. The next target to watch for is 1.35.
 More important from a market perspective is the yield on 10-year US treasuries. As noted last week, the yield spiked to high of 1.96 per cent before reacting to 1.84 pc.
The 1.90 level represents a key level. Crossing over to the topside would open up a new trading range for the bond markets and signal that interests are beginning to bottom out.
USD-INR: The USD turned down well below the key resistance level of INR 55.60 but stayed above its 200 DMA closing the week at 54.86.
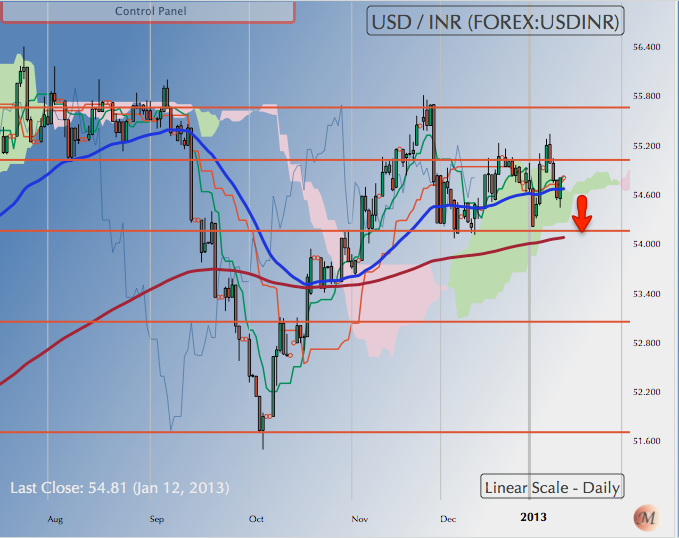 I continue to favour a wave count that sees the USD retest the highs of INR 57.3 by May end.
Over the next week or two, the USD could move sideways but with an upward bias. A retest of 55.6 could be on the cards in the next two weeks.
A decisive break below the 200 DMA would negate this analysis.
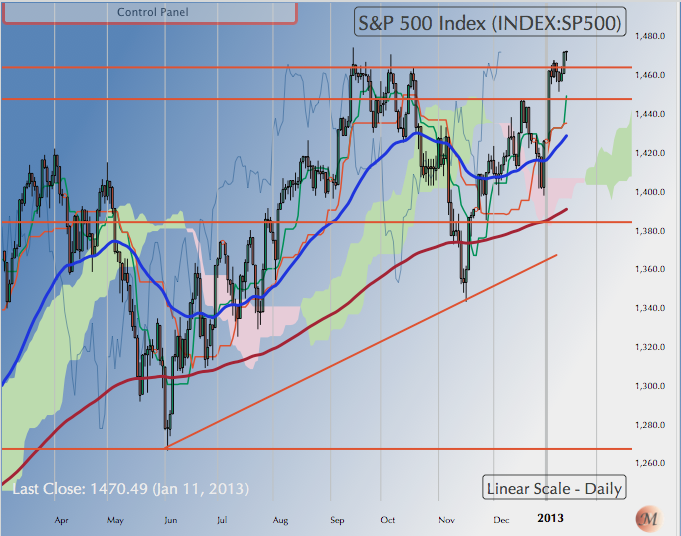 S&P 500: There is no arguing with markets making new highs. SPX made a new closing high 1472.12 before closing the week at 1472.05.
SPX continues to be in an uptrend. Using the same wave count that led me to expect new highs despite all the doubts and corrections of the past weeks and months, I think we will continue to see new highs on the SPX till the middle of February.
However, the US market is not monolithic. It rotates sectors. For instance, tech stocks have been seriously correcting while SPX made new highs. Therefore look to take profits in stocks that show signs of having peaked out.
Shanghai Composite: This week we look at Shanghai rather than NASDAQ. The latter continues in an uptrend and some frontline stocks that are nearing end of their corrections like Google or IBM could continue to propel it to new highs. Will revert to it next week.
Shanghai made a low of 1669 in October 2008, which sort of corresponds to the low the US and world markets made in March 2009. It then rallied to a high of 3498 and has been correcting in an orderly fashion since then.
In terms of price the recent low of 1949 could be the bottom of the market. Shanghai is presently well above its 200 and 50 DMAs and could rally to 2500 before correcting. The low in the following correction could confirm the bottom.
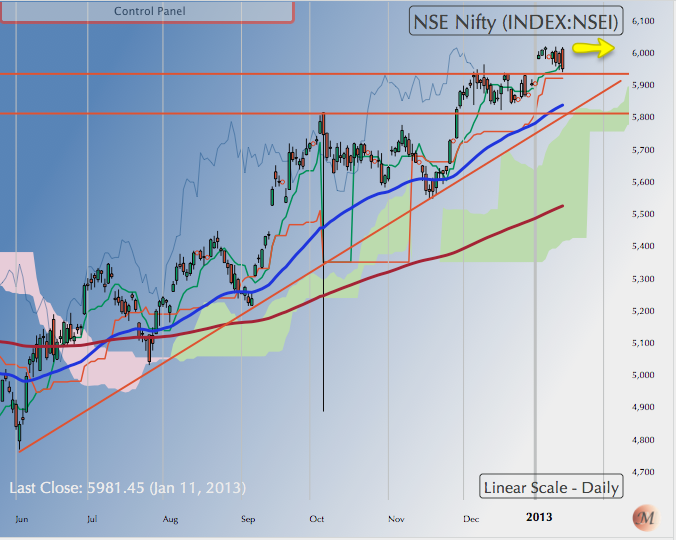 NIFTY: Nifty crossed over atop the 5950 pivot in a rather dramatic fashion on January 2 but has faithfully returned to retest the level from the topside. The pivot could be tested multiple times since it is critical to the continuation of the rally.
Upon the market holding above 5950 over the next week or two, the rally should continue to its logical target of the previous top of 6350, albeit with corrections. A break of 5950 would precipitate a rather severe bout of correction. Keep stop losses tight till the market clears the 5950 area safely.
NB: These notes are just personal musings on the world market trends as a sort of reminder to me on what I thought of them at a particular point in time. They are not predictions and none should rely on them for any investment decisions.
Sonali Ranade is a trader in the international markets