Short-term wave counts show that there could be minor pullbacks next week, which will be small counter-trend rallies to correct for over-sold conditions. says Sonali Ranade
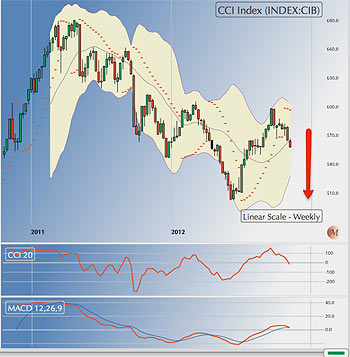 Continuous Commodity Index [CCI Index]: The weekly chart shows the price trend of an equal weight index of 17 commodities comprising metals, energy, soft and agri commodities. The index has been in a downtrend from March 2011 and shows no sign of having bottomed out.
The most likely wave count indicates that we may be in the terminal C part of the correction in commodities, which could take the CCI index from its current level of 560 to about 510. That's about a 10 per cent correction from current levels. Note that on the oscillator charts, the downtrend has just been confirmed. While a strong support can be expected in the 500 region, there is no guarantee that the correction will stop there. Short-term wave counts show that there could be minor pullbacks next week, which will be small counter-trend rallies to correct for over-sold conditions.
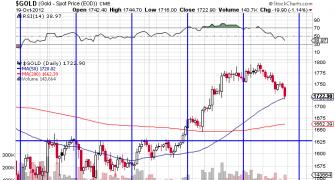
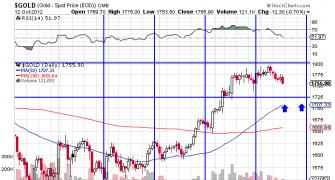
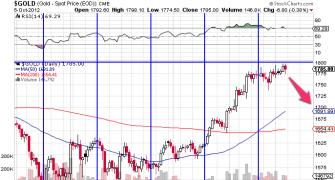
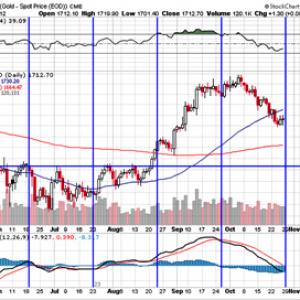
 Gold Index: The weekly chart above for gold is really a no-brainer. The metal's price behaviour hasn't quite followed the CCI Index discussed above but the pattern is analogous. The main difference between gold and other commodities lies in the failure of the fifth sub-wave of the third wave down that led to huge pullback from the $1530 region to $1800. However, the long-term trend has not changed and has reasserted itself again.
 Gold closed the week $1677 in a rather sharp one-day fall. Barring minor pullbacks the downtrend is likely to continue over the next few weeks. A bounce from the 200 DMA in the $1660 region can be expected but is likely to be transient. The wave counts favor a much deeper correction and might involve a retest of $1550.
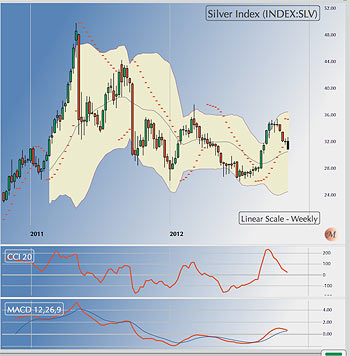 Silver Index: Silver effortlessly pierced through it 200 DMA at $31.27 to close the week at $30.89. The metal presents an extremely bearish picture and we can at the very minimum expect a retest of the last low at $26 in the current correction over the next few weeks. Unlike in the case of gold, the prospects of the floor at $26 being held appear slim. A minor pullback may be in the offing early next week. It won't last very long though.
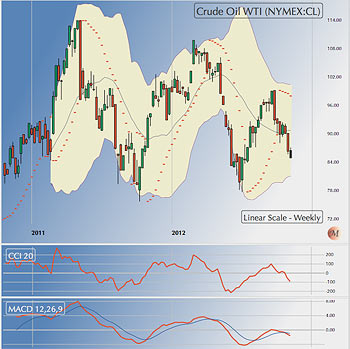 WTI Crude: Crude is unlikely to defy the general trend in commodities all by itself. It closed the week at $84.86 just a nick below the trend line running up from January 2009 lows. A retest of $78 is almost certainly on the cards, at which point crude would be a great buy. Crude is one commodity where one could see a failure of the terminal wave 5 down. So be alert for a buying opportunity.
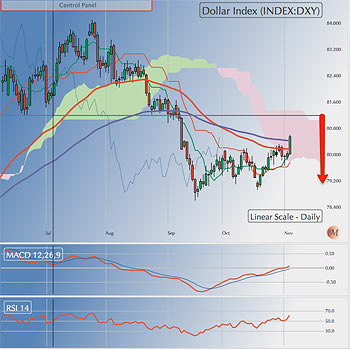 US Dollar [DXY]: The $ has been in a counter-trend rally from its recent low of 78.62 which may be nearing completion. The DXY Index has a strong overhead resistance at 81.20 level. The dollar's correction down from its high of 84 in July of this year is far from over and trend down may reassert itself shortly. In fact the thrust of the $ through its 200 & 50 DMAs in the 80.40 region is almost certainly a head fake that is unlikely to last. Bulls should be very wary of the 81.20 overhead resistance and watch out for a bull trap.
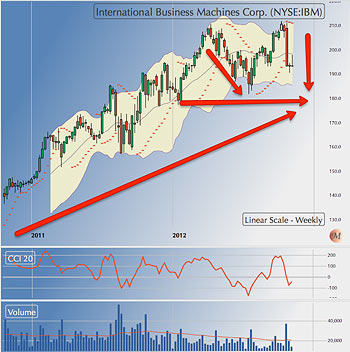 Euro$: [EURUSD]: The euro has been in a downtrend since its recent top at 1.31 in September 2012. It made an attempt to rally up which failed at well below 1.31 and is now in a wave 3 fall. First support lies 1.28 followed by more robust support at 1.26. Euro$ closed at 1.2836. Minor pullbacks apart, a breach of 1.28 will accelerate the downtrend. However, expect a small bounce early next week to correct the oversold conditions created last Friday.
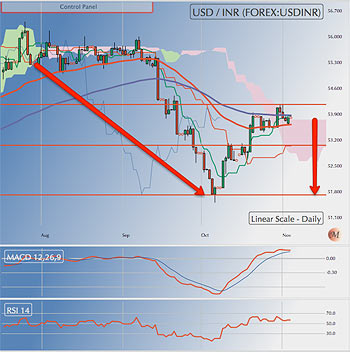 USD-INR: The $ confirmed the onset of a fresh downtrend against the INR by turning down from INR 54.30. The correction in the $ from 57.30 has not quite met the criteria from full-fledged impulse wave down. If it were an impulse wave then we would be in the terminating wave 5 that could retest 51.40 again. However, if the correction down wasn't an impulse wave as I suspect, then we are in a Wave b down for the rally from 51.40 to 54.20. In that case the correction now underway could terminate much earlier than 51.40.
First support for the $ lies at its 200 DMA at 53.40 followed by a deeper support at 53 and 52.50. It is too early to tell if a retest of 51.40 is on the
cards. The trend though is unambiguously down for the dollar.
IBM: Since stocks in Indices such as the NASDAQ or S&P 500 don't move in lock step, the indices can sometimes obscure the underlying price trends by being a mixture of many things. At such times it is instructive to look at market leaders to understand the underlying moves in the broader market. IBM Is one such leader, not only in the tech sector but also as a proxy for real trends in industry, services and manufacturing.
First off, note that the correction in prices has been underway not from September, as the NASDAQ Composite would lead you to believe but from the end of March 2012. This salient fact is obscured on the NASDAQ chart by a head-fake in September peak at 3200. By this reckoning we are either in Wave C of the correction from March or in Wave 3 of a large impulse wave down.
However, note the first 5-part impulse wave down from 210 to 180 for IBM is easily outdistanced by a simple a-b-c corrective wave back to 210 from 180 showing that the underlying trend still favors the upside. Therefore, we can safely assume we are in a Wave C here and not in a large wave III down. In short, market leaders like IBM, Google and Apple are indicating a flattish correction rather than a collapse.
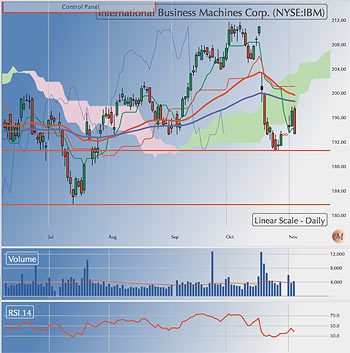
IBM will probably bottom out at 180 if not earlier and could follow through with a higher high. That doesn't mean the NASDAQ composite will do so. Rather, it shows no collapse in markets is imminent as the bears keep preaching. We are into a normal rounded top flattish correction spread over many months. Not a good time for investors but traders can have a ball playing the volatility.
Other technology leaders like Google, Apple, along with stocks like GE show similar price patterns and trend. US banks are having a ball what with Uncle Ben handing out the lolly. That further points to flattish corrections rather than bearish collapses.
 NASDAQ Composite: Armed with the insight offered by IBM it is easier to decipher the NASDAQ chart. First note that the most obvious next support from current level of 2982, namely the strong support at 2900 followed by the one at 2800, is unlikely to hold. Instead the NASDAQ Comp may bottom closer to 2700 in the current correction. This insight would not be possible until you have seen the IBM chart.
Note also that Friday was a "key reversal day" when the index opened higher than the previous high and closed lower than the previous low. That's pretty bearish and almost certainly confirms the onset of a fresh leg of the downtrend.
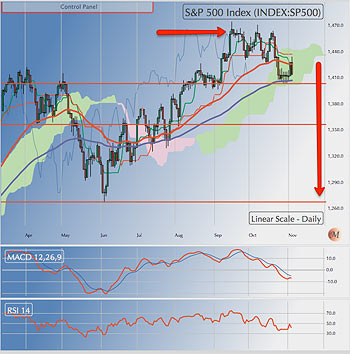 S&P 500 [SPX]: The above is a daily chart of the S&P 500, not weekly as the others, which is why it looks more bearish and scary. In fact SPX is the stronger of the many US indices bolstered at is by the banks and a large services sector. But correct it will.
First, as we noted, there is a triple top of sorts at 1470. Second, while NASDAQ showed a key reversal day on Friday, the close on SPX was above the low of Thursday. Else we were pretty close to a key reversal. Third, using the same wave counts as those on the NASDAQ, we are into Wave 3 of a C down whose target would lie somewhere in the 1270 to 1300 region.
 CNX NIFTY: Fasten seat belts!
First notice lone star on Friday on the charts. It is like to become an "abandoned baby top" on Monday when taken together with the "key reversal day" in the US. That's pretty bearish and signals the onset of a fresh leg down into the ongoing correction.
First support lies at 5550, [the top of the gap that trapped bears and fuelled this rally] followed by more support in the 5350-5400 region.
The big question though is: do we go all the way to 4800-4900 region? As I mentioned weeks back, the mini-crash on October 5 was ominous in as much as it showed how hollow the market really was. Then, as now, my sense is that the market will try to go there. The only doubt stems from the fact that we are in a correction from November 2011 and there are hardly any bulls left un-slaughtered in the market. So the fuel to take the market down to 4800-4900 has to come from bulls that got caught up in the current rally. That's sparse pickings. On the other hand, hollow markets can fold up simply by absence of fresh buying and that will certainly be the case over the next few weeks.
 A break below 5530 will be the first signal that we are in fact into a terminating C for the entire correction that began in November 2011. However, it will take weeks to unfold.
NB: These notes are just personal musings on the world market trends as a sort of reminder to me on what I thought of them at a particular point in time. They are not predictions and none should rely on them for any investment decisions.
Sonali Ranade is a trader in the international markets