 | « Back to article | Print this article |
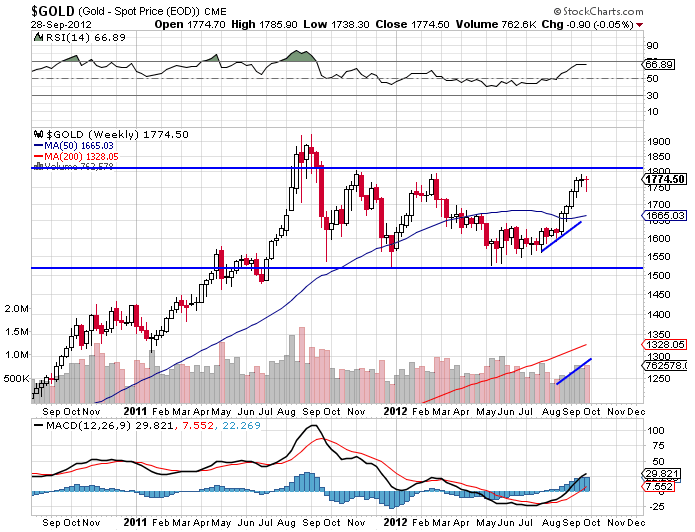 Gold [$GOLD]: Gold needs to break above $1800 or below $150 to establish a new trend. As mentioned in my last post, gold could continue at elevated levels but below the $1800 for a few weeks. The probability of resumption of the bullish trend should not be ruled out.
In the immediate future gold could head down slightly to correct for the rise from $1525 to $1775. This would not however be an intermediate downtrend but a sideways movement well above the 50 DMA in the $1700 area but below the $1800 breakout point.
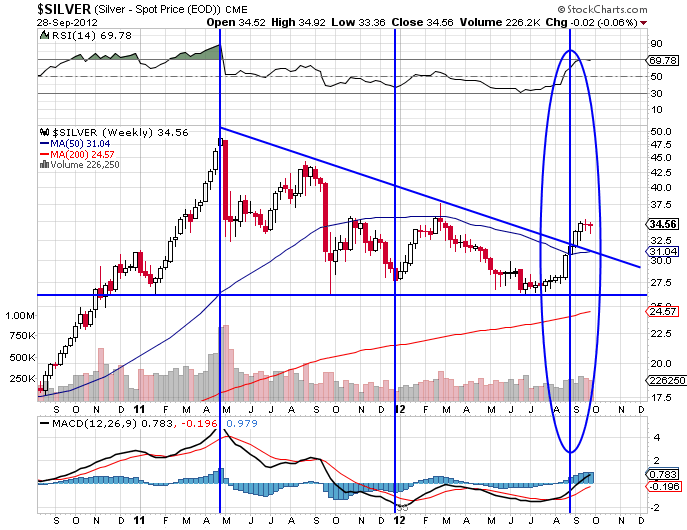 Silver [$SILVER]: After gold, the silver chart is no surprise. Like in gold expect a sideways corrective movement for a few weeks below the breakout point at $37.50 but above the 50 DMA in the $31 region.
Silver like gold can continue at elevated levels for some time. This is not the beginning of a new downtrend. This analysis would be negated on a breakout above $37.50. For bulls and bears, the critical level to watch for $37.50 for silver and $1791 to $1800 for gold. Until a confirmed decisive breakout happens, an elevated but sideways movement would indicate we are still in an intermediate down trend from the previous main top at $48. [$1920 in the case of gold.]
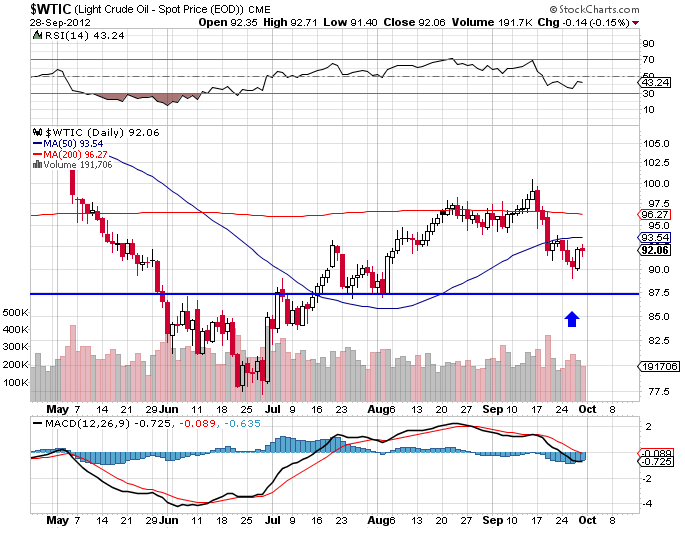
WTI Crude [$WTIC]: I am surprised by the intensity and depth of the correction in crude at this point in time. First support for crude lies at $87.50. Until this level is decisively violated, I would consider the uptrend in force since the last bottom at $77 to be in force.
I would buy crude at dips to $87.50.
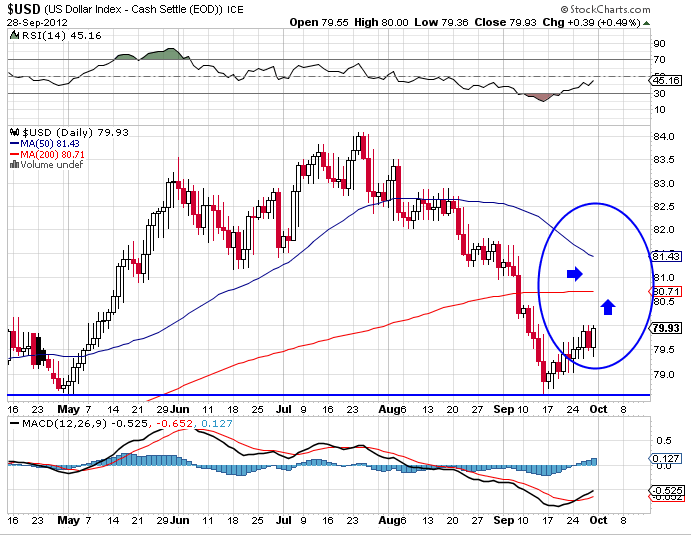 US Dollar [$USD]: The US dollar found support at 78.50 and has since moved up steadily to $79.93. At least on one wave count, the correction in the dollar may be over.
The next trend deciding even for the $ would it is overhead resistance 80.71. On successful negotiation of the 200 DMA the $ would have confirmed its intermediate uptrend that had come under a cloud on its recent violation of that support. Not bearish on the $.
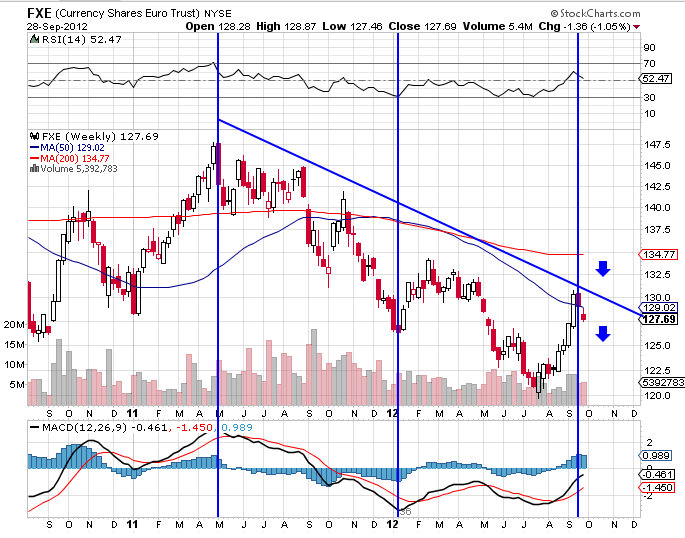
Euro$ [$FXE]: The euro may have completed its upward correction and resumed its major trend down. Note, it never made it to the 200 DMA area in this bounce which is a surprise.
Euro$'s next logical target is 1.25 followed by a retest of the 1.20 area. It will drift down towards those targets over the next few weeks. Euro looks very bearish for now.
 $-INR: $ continued to correct against the rupee and is approaching a long term key support at INR 52.50 which should not be violated for the $'s long term bullish trend to continue. The $ has already violated its 200 DMA at 53.50 in this correction.
A sideways movement from here but above the key support level of 52.50 could continue in the next few weeks. If the 52.50 level is not violated, the $ could resume its uptrend against the Rupee.
I would buy the $ at dips towards the 52.50 support.
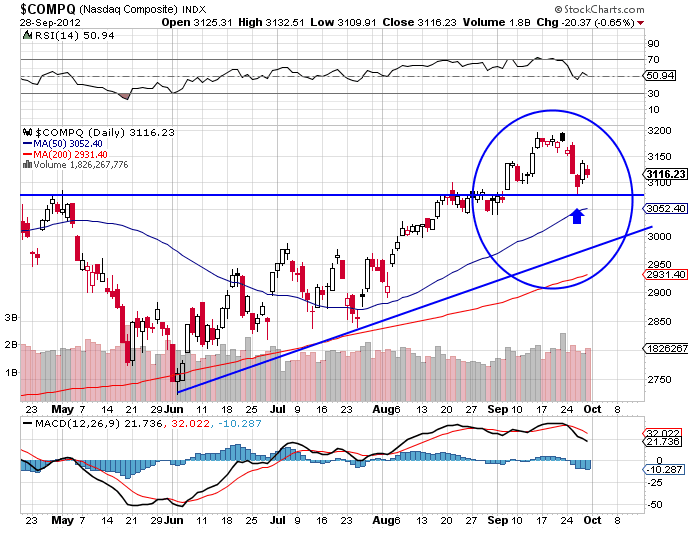 NASDAQ Composite [$COMPAQ]: NASDAQ Composite promptly reversed its course from first support 3070 and continued its gravity defying rally. It could soon be retesting 3200 levels again.
The US markets have had a nice four-year bull run from March 2009 that just doesn't seem to be ending. The markets are on an extension. That's not surprising after the severe crash in 2008. However, these extensions can terminate at any time without notice.
By wave counts we should have been in a correction long ago. But on several counts, this rally can extend further till end November. Protect your longs with tight stop losses. The market will can turn on a dime at any time.
 S&P 500 [SPX]: The above weekly chart for SPX indicates that the index is currently at its first support 1440. A violation of this support will be the first indicator that the extensions in the rally are now under threat.
The situation in the SPX is similar to the one in NASDAQ. The market could resume its uptrend from 1440 to lurch higher in an extension that could stretch till November end. If so enjoy the ride with tight stop losses on longs.
Avoid sales till the market confirms a reversal.
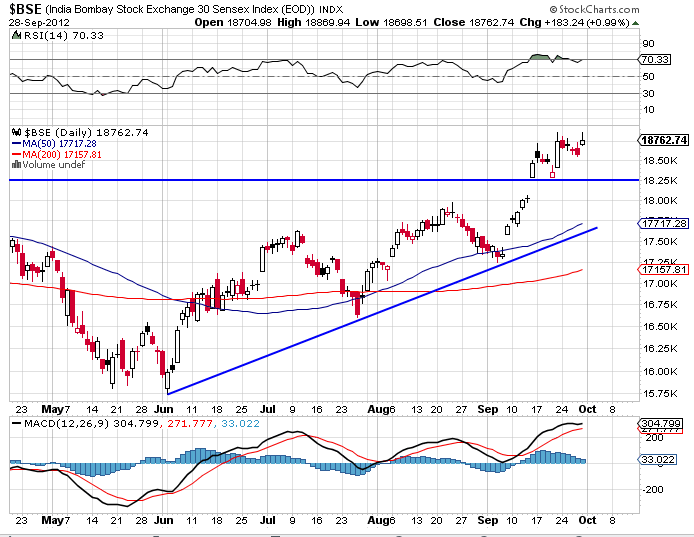
Sensex [$BSE]: Having successfully tested 18,500 the Sensex could next proceed to test its first overhead resistance at 19,000 followed by the one higher at 19,700. There is little indication of any reversal of the uptrend so far although the market appears over bought.
In terms of wave counts, there is plenty of room for this rally to extend along with the US markets till end November and still continue in its C-flat correction. Enjoy the ride with very tight stop losses.
NB: These notes are just personal musings on the world market trends as a sort of reminder to me on what I thought of them at a particular point in time. They are not predictions and none should rely on them for any investment decisions.
Sonali Ranade is a trader in the international markets