In India, however, the Nifty continues to climb a wall of worry as general elections loom, fiscal deficit surges and the current account deficit is barely under control following subdued gold and crude prices, says Sonali Ranade.
The world equity markets continue to exude cheer, reflecting modest growth in the global economy accompanied by fairly loose and benign monetary conditions. Shanghai is an exception as authorities grapple with the problem of excessive speculation in asset prices financed via the Dollar carry trade. It is not a bubble that lends itself to easy resolution.
Back in India, Nifty continues to climb a wall of worry as general elections loom, fiscal deficit surges and the current account deficit is barely under control following subdued gold and crude prices. This largely reflects the fact that much of the negativity was already in the price. All said and done, Indian GDP continues to grow at five per cent plus rate and a financial bankruptcy on the external account is a still remote event.
Under the hood, there is considerable churn in stock in the US and European markets. Should the interest rate curve start sloping upwards, reflecting normal real growth, the financials will stand to make a lot of money and their valuations are pretty cheap given the bad patch they have had since the year 2000. Look for values in this sector for further impetus to S&P 500.
Happy trading.
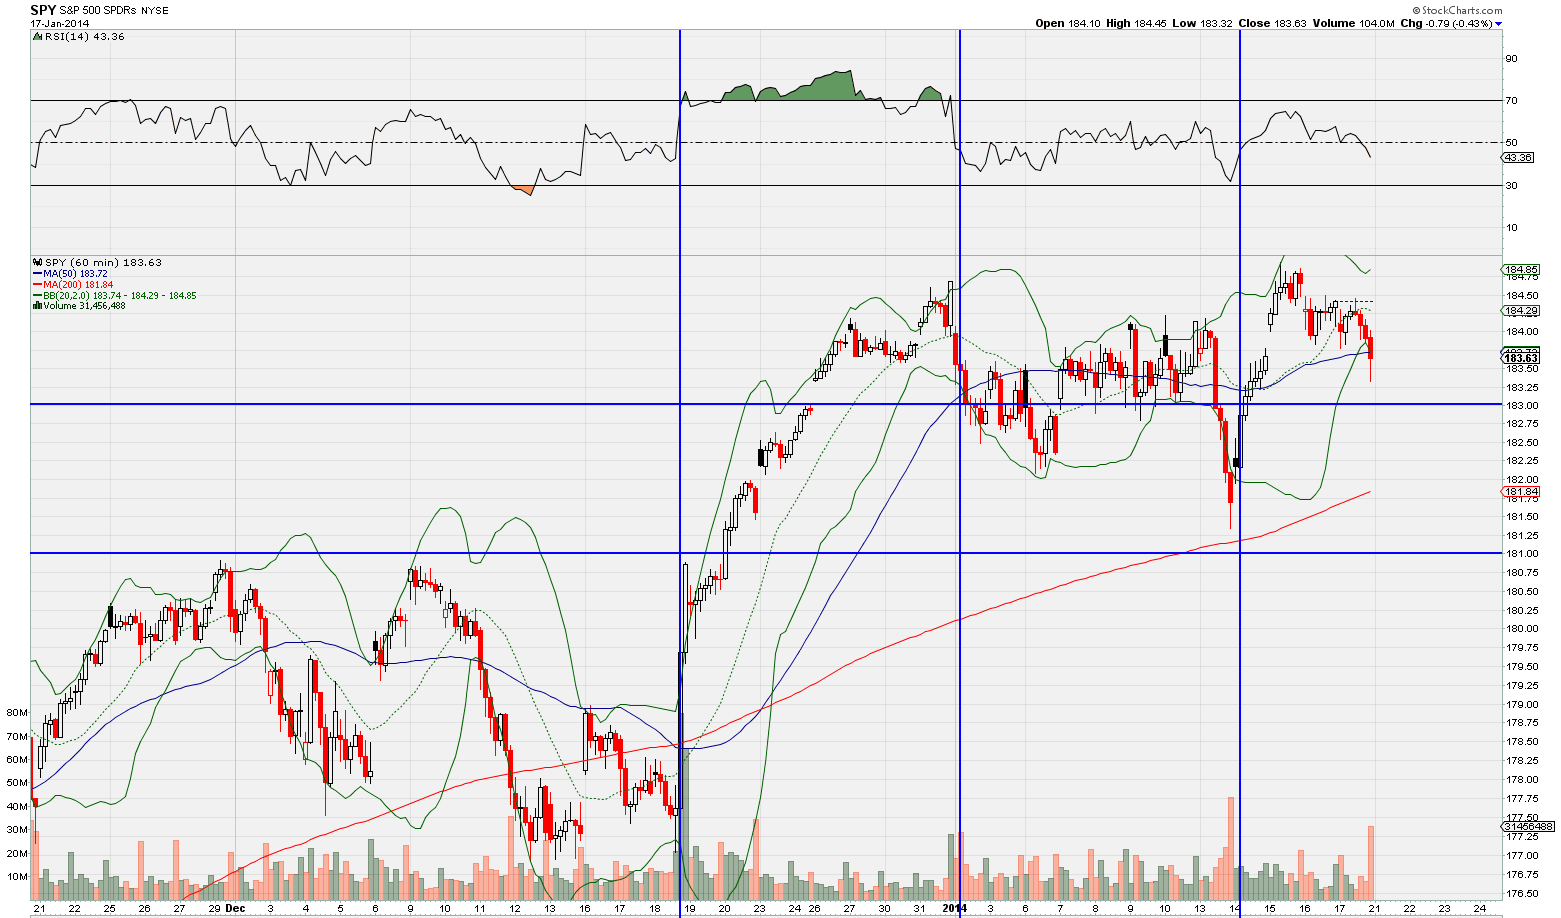 S&P 500: Some people have asked for analysis focused on the near-term. So presenting the hourly chart in $SPY above. To my mind, the drop from 184.75 on December 31 to 181.25 on January 14 corrected the run-up from 177 to 184.75. $SPY has since rallied to high of 184.85 and is now correcting for that run up. I would be greatly surprised if the bulls yielded the gap just below 183.50 to the bears in this correction. Following the gap there is much more robust support at 183.
 I would expect $SPY to resume its rally in the next to 184.25 and beyond. There is really nothing bearish on the charts so on the charts as long as 181 level holds.
 Nasdaq 100: The near term picture for the Nasdaq 100 [$NDX] is similar to that of $SPY.
In my view, the drop from3591.25 to 3500 corrected the run up from 3430 to 3591.25. $NDX then went on to make a new high of 3610 and is currently correcting for that run up. First support lies at 3580, which held up on first test on January 17. More support exists at 3570followed by that at 3540.
My sense is that the gap between 3580 and 3590 will not be filled here and the index is likely to rally sharply to new highs beyond 3617. Position traders may like to keep their stops just below 3520.
Nothing remotely bearish on the index as such but under the hood tech stocks are showing some signs of exhaustion. On the other hand financials are likely at the beginning of a fresh surge up. So do take a look at what you hold than just the index.
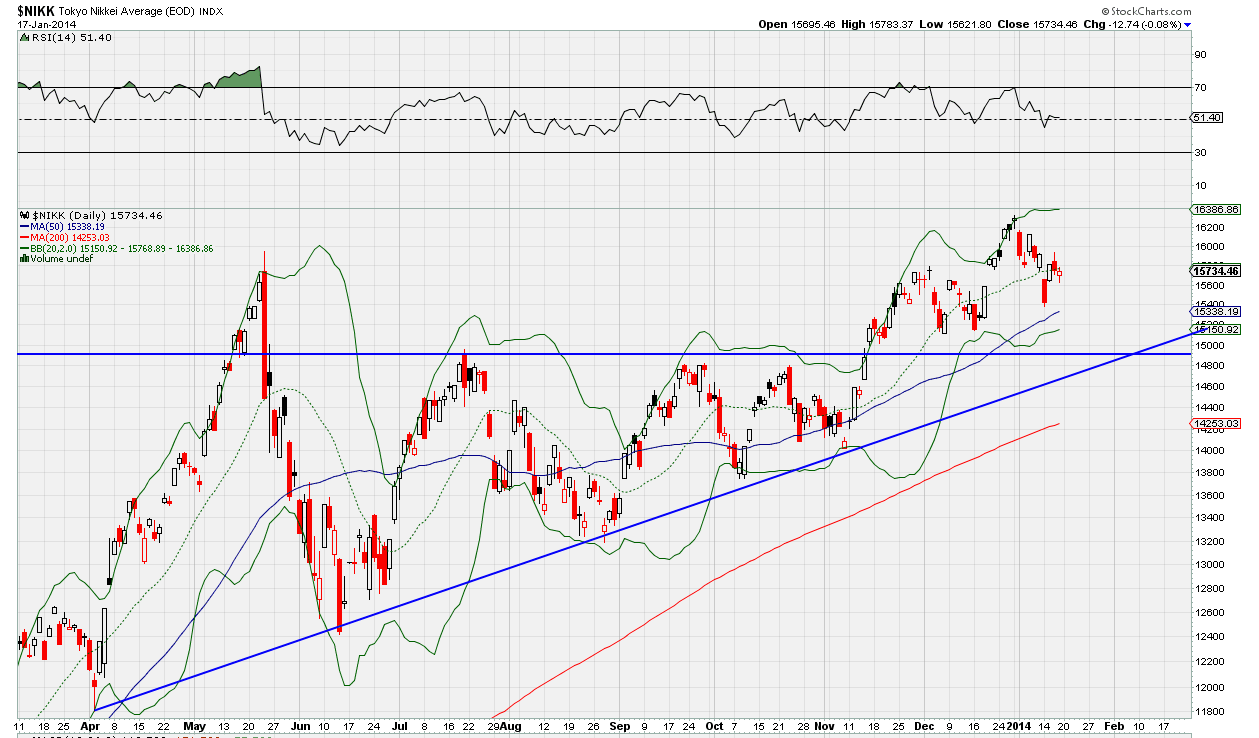 NIKKEI 225: Nikkei is in a very strong up trend with first target of 16,700. I think the Index intends to clear the previous high of 18,260 in the next 12 to 18 months. That said, 16.700 would be a fairly formidable overhead resistance.
Nikkei made a high of16320.22 on December 30, 2013, and has been correcting since then. Its 50 DMA is currently at 15,368, which should act a support and has been tested successful once. Further support lies at 15150 followed by a more robust floor at 14800. My sense is that 15350 floor is unlikely to be taken out in this correction.
On the other hand I see a high probability that Nikkei may stage a very sharp rally to just under 16,700 and correct from there in a fairly complex move. The next few weeks are for consolidation. But my sense is that consolidation will happen in a higher trading range of 15,800 to 16,700 rather than the current one. Nothing bearish about the Index.
 DAX: $DAX is in a strong up trend that will see very brief though sharp corrections over the next two weeks. The Index is targeting 10,000 plus before the end of May.
There will be a bit of consolidation before the index makes a bid for 10,000 and my sense is that having seen a sharp running correction from December 2 to January 14, the index is more likely to spike up to just under 10,000 early next week and then consolidate a bit above 9700 for a week or two before making another attempt at the target.
Day to day plays isn’t my forte. Simply don’t have access to the kind of data necessary for a proper analysis of the technical play. So take the above with a bit of caution. However, I am pretty much confident that [a]10,000 will be taken out much before May and [b] it won’t be taken out at first or second attempt.
Position traders shouldhold with a stop under 9700. There is nothing bearish in the index yet. And all indications are for an early take down of 10,000.
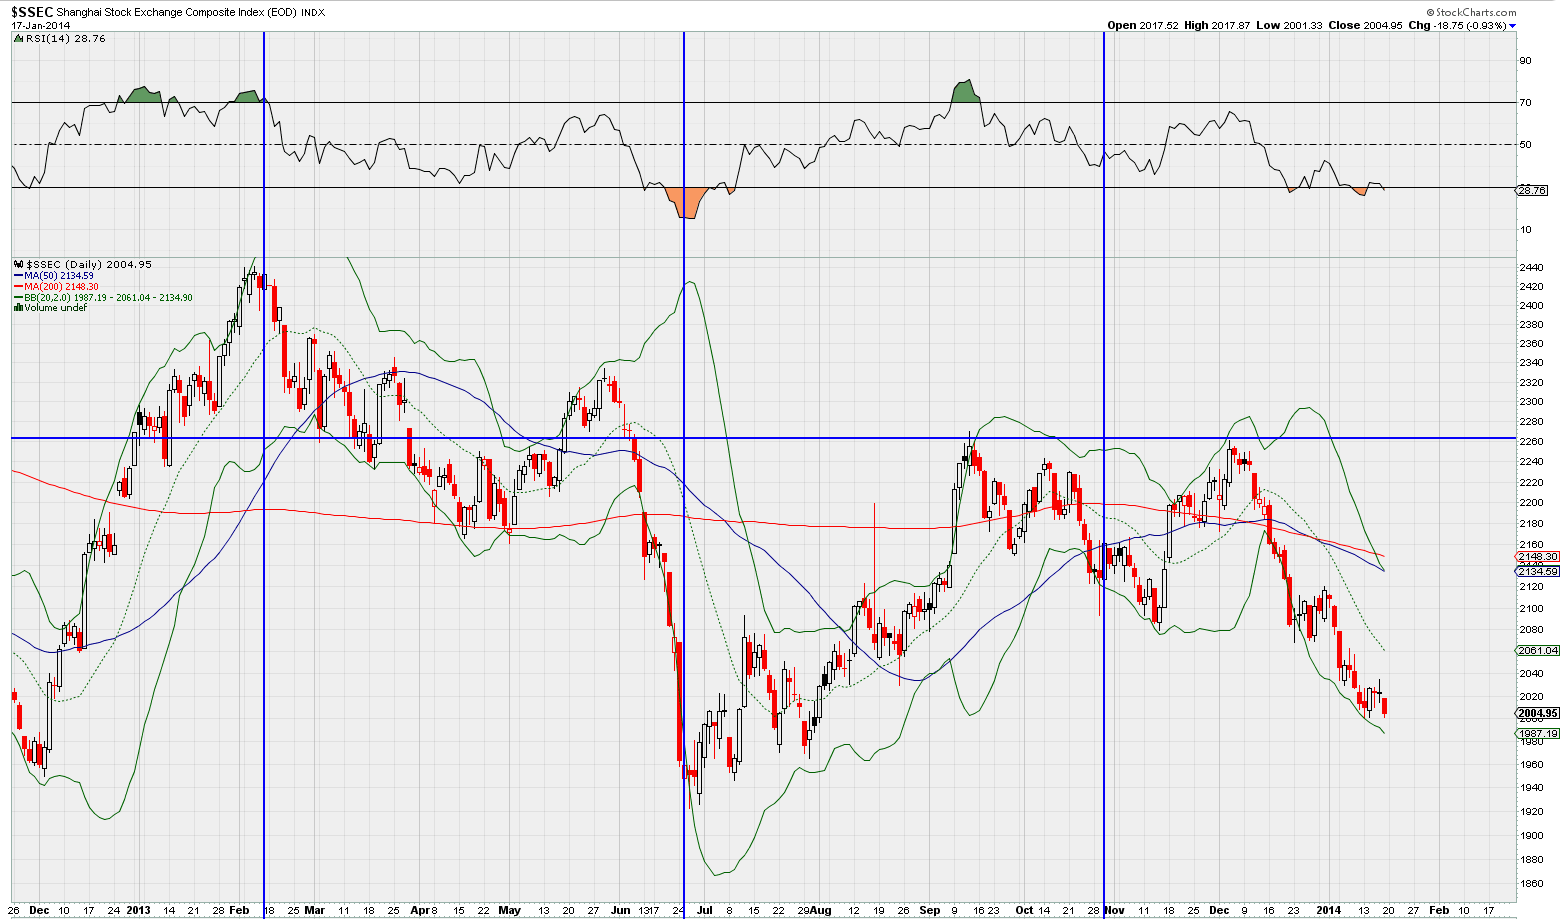 Shanghai Composite: Among the major worldequity markets Shanghai continues to be the most unambiguously bearish. The Shanghai Composite Index appears headedfor a retest of its major floor at 1660 by end of May. There may be minor corrections on the way butthe direction is clear enough.
The other noteworthy technical event is the generation of a clear sell signal so late in the bear market with the 50 DMA moving well below the 200 DMA. I wonder what the market knows what we don’t. Avoid calling a bottom on this one. Wait for clear capitulation. In the near term the index is clearly oversold and could pause a bit. But the respite won’t last long. Make a buy list but wait for capitulation.
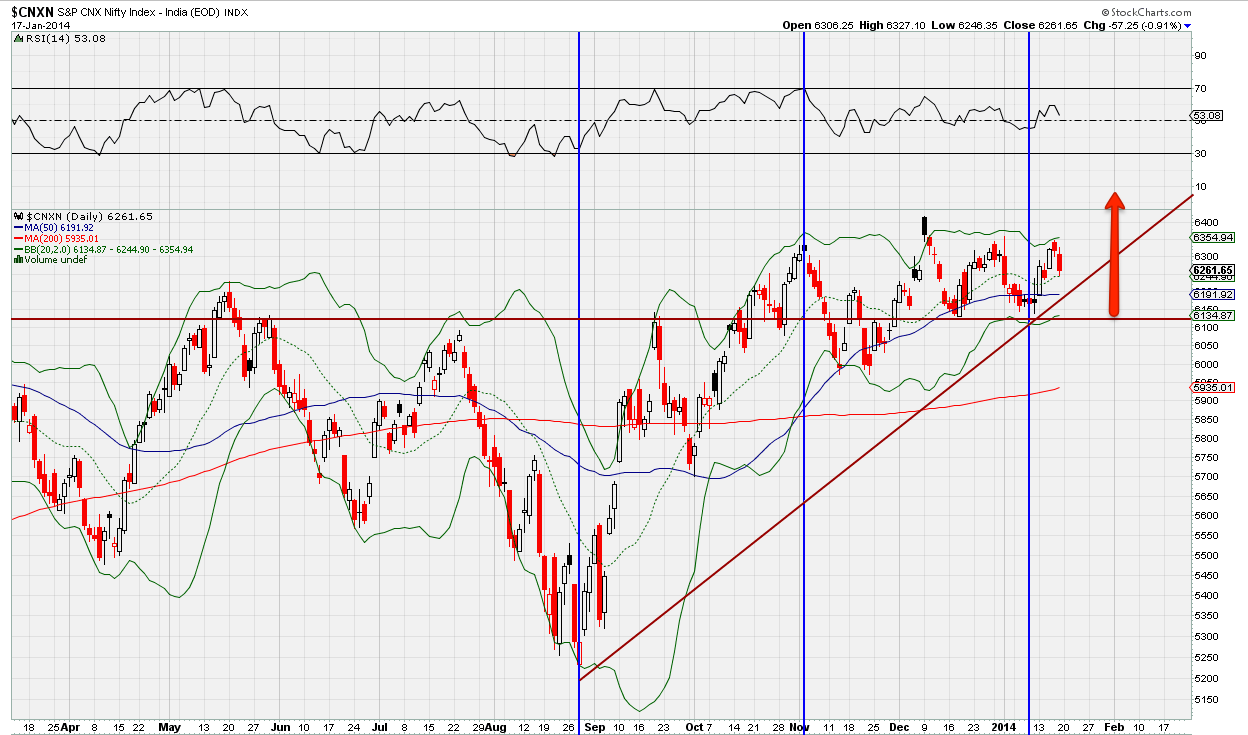 NSE NIFTY: NSE NIFTY appears to beclimbing a wall of worry what with the Indian economy being ringed with huge fundamental problems at the macro level. But then markets have been so hammered in recent six years of a bear market that I for one wouldn’t question the market’s wisdom. This blog is just about technicals and the message from them is one of cheer. The markets are headed up though only they know why!
The NIFTY made a technical low of 5118.85 on August 28, 2014, and in many ways it can be said to have marked the end of the bear market that began with the crash of January 2008.
The NIFTY has been inuptrend since then making a high of 6342.95 on November 3, 2013. It went into a sideways correction since then and to my way of reckoning, the correction to the run up from August 28, 2013, to November 3, 2013, ended January 8, 2014, at the low of 6160.35, making for a fairy shallow correction to the indices.
Since then the Index has rallied to high of 6346.50 and has fallen back a bit from there. The correction is minor and to be expected as the index can be expected to take three or four attempts to break free to new all-time highs. My sense is that we could wellsee NIFTY at 6600 by the end of May or just before India goes into polls for anew government.
Nothing bearish in the NIFTY as far as technicals go. I would keep a sharp stop loss at 6100.
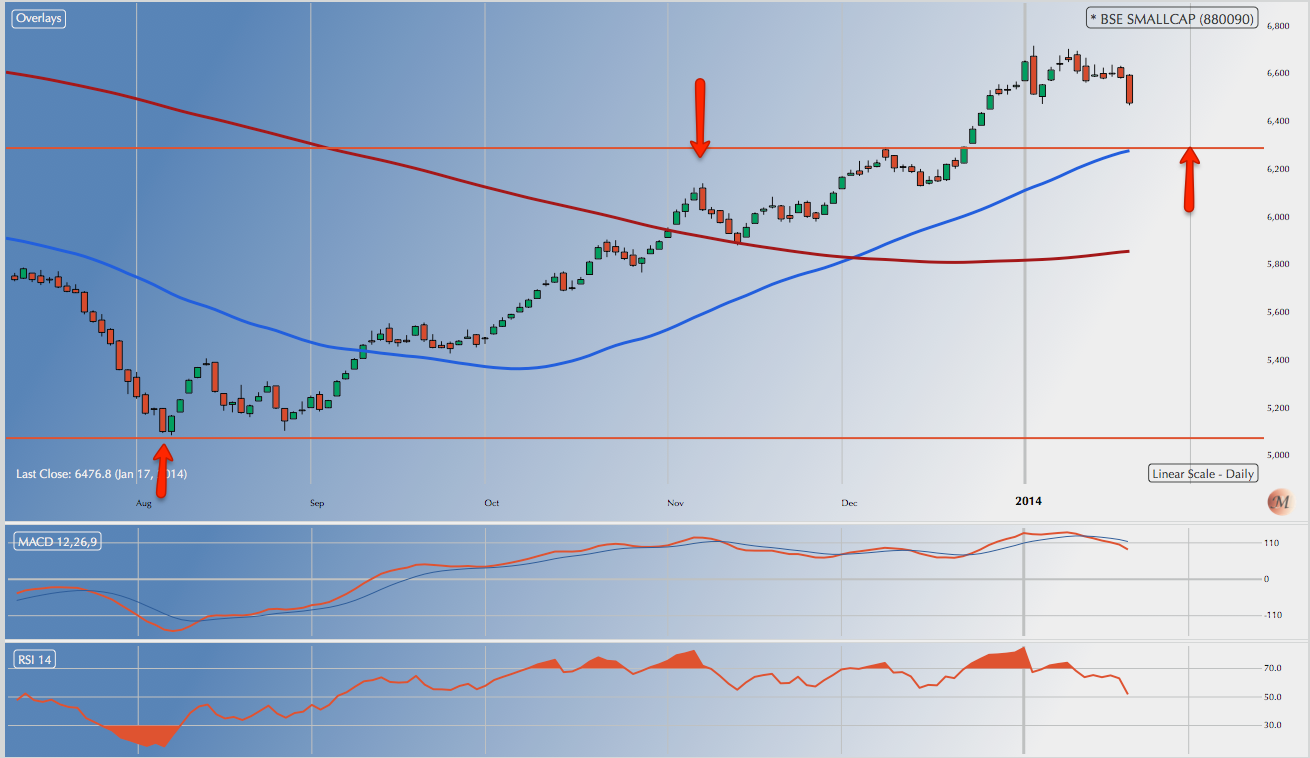 BSE Small Caps: The BSE Small Caps Index [BSCI] made a low of 5100 on August 28, 2013, and rallied from there to a high of 6145 on November 8, 2013. It went into a running correction from that point but continued upwards and it is possible that the running correction ended January 17, 2014, although the possibility of another test of the 50 DMA at 6270 in the next 10 days should not be ruled out.
The index’s 50 DMA crossed over above the 200 DMA on December 3, 2013. Currently the Index is at 6476.76, well above the 50 DMA as well as the 200 DMA at 5851.25.
The Index Price ROC is in oversold territory. I expect the index to head for highs beyond the 6750 level. The steepness of the rally is largely owed to the way stocks were hammered on the way down. Having said that, there is nothing bearish on the charts. I would expect a clear breakout of the small cap index above 7700 by May end or before elections.
Stay with liquid stocks when dabbling in small caps.
NB: These notes are just personal musings on the world market trends as a sort of reminder to me on what I thought of them at a particular point in time. They are not predictions and no one should rely on them for any investment decisions.
Sonali Ranade is a trader in the international markets.