 | « Back to article | Print this article |
On the whole expect a very treacherous markets as the price levels could be driven purely by the technical play between bulls and bears as the new trend is established, cautions Sonali Ranade
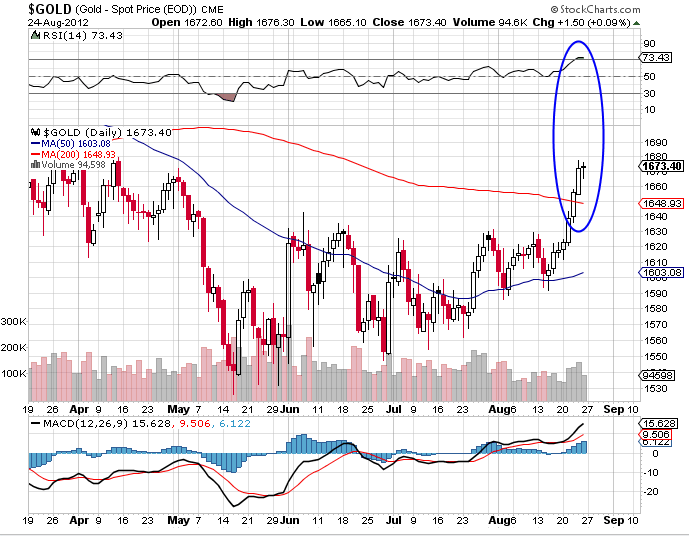 GOLD: The gold rally was late in coming but has finally turned up fairly strong. Gold pierced through its 200 DMA around 1648 and closed the week at $1669.90. The question now is [a] is this bullish breakout and [b] where does gold go from here. The answer depends on your preferred wave count and is likely to be hotly contested in the market whichever way it goes.
The bullish case rests on the assumption that gold has corrected in an orderly A-B-C wave structure from the top of $1920 to the low of $1527 and therefore the correction is complete. In that case, the sharp breakout atop the 200 DMA is genuinely bullish. If so, gold should correct down to $1650 soon, and upon the price holding above the 200 DMA, should signal a new bull rally in gold. This scenario is quite possible.
The bear case rests on the assumption that the correction down from the top of $1920 is in fact the start of a bear market in gold and therefore the correction should have another leg to it. In short we are in wave 4 up of the first impulse wave down and the break atop 1648 is merely a bear rally. I favour this view unless proven otherwise by price action.
Sometimes, as a trader you should let the markets resolve issues without taking sides. I would wait for the market to retest the 200 DMA before taking a fresh view of the price action. In passing, one may note that most commodities are approaching peak-out points and metals may well join the herd. In such a case gold may well coast along at the current price without going significantly higher than $1700.
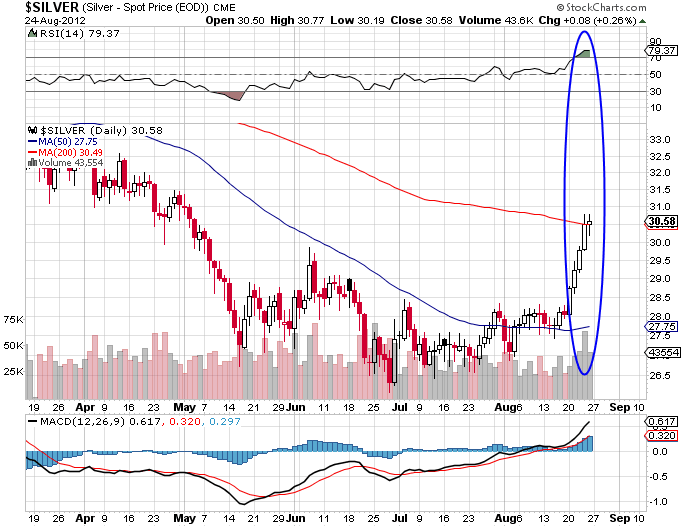 Silver: Silver has rallied in sympathy with gold. It closed the week at $30.78, a touch above its 200 DMA which is the $30 area. Silver could rally to $32 whereupon it hits the long-term, downward sloping trend-line that has capped previous bear rallies.
Silver has followed a significantly different trajectory in its current correction than gold. It wave structure is also quite distinct from gold. The counter-trend rally in silver could be a jagged sideways movement between $35 & $30 for some weeks. This also means that later in the correction one could see the down-sloping trend line also violated.
By no means bullish on silver. But the metal has signalled a counter-trend rally that could have treacherous swings. It is best to sell very strong rallies to the upper band of $35 and buy the drops. Long-term shorts should be avoided till the rallies show clear signs of exhaustion. Note, silver is overbought.
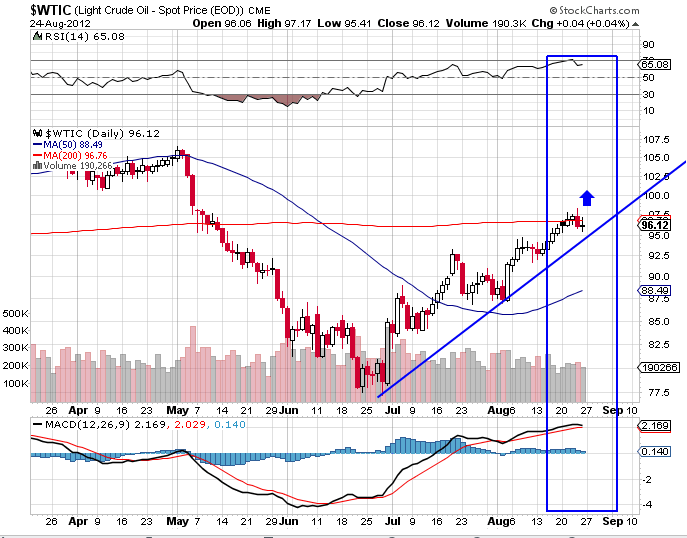 WTI Crude: WTI crude closed the week at $96.15, a touch below its 200 DMA which it pierced through on August 21. A quick retest of the 200 DMA augurs well for continuation in the crude rally.
As per my wave counts, on a successful retest of the 200 DMA from the topside now underway, crude could rally to $100 in the next week before going into a correction. The probability of overshooting the $100 target is fairly high.
A significant correction in crude prices may have to wait till after the price rallies above $100. Crude remains a buy on dips.
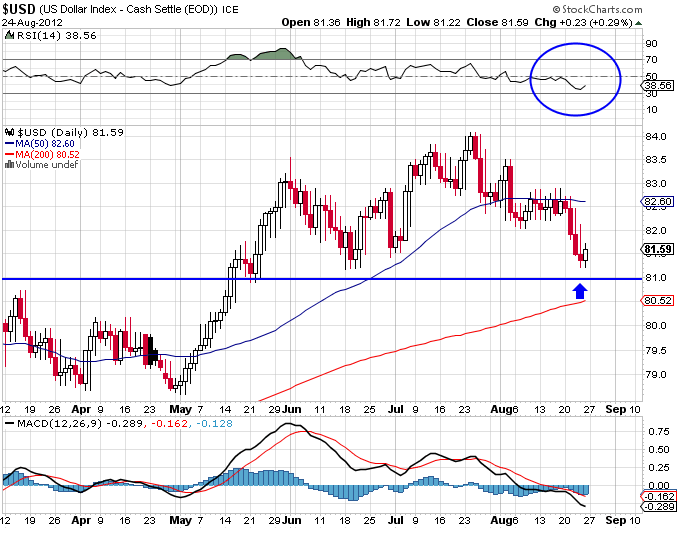 US Dollar: The dollar closed the week at 81.36 after having made a low of 81.22. In my opinion, the first leg of the price correction in the dollar from its recent top of 84.30 is over. In terms of time, the correction still has some way to go.
Note, the index's 200 DMA is positioned at 80.75 while the upward sloping trend-line marking the current rally is well above the 200 DMA. The dollar has been supported by the trend line and not the 200 DMA. Further, the dollar is oversold.
During the ensuing week the dollar could retest support against the rally's base trend-line and rally to its first overhead resistance at 82 followed by a higher target at 83.
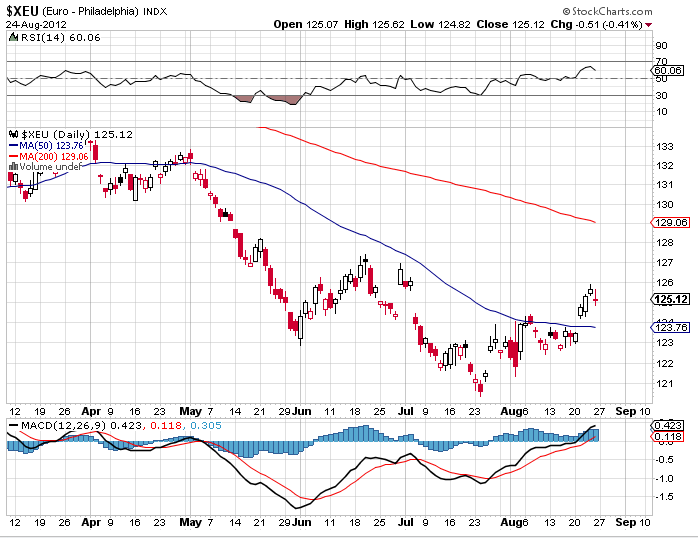
Euro$: Euro closed the week at $1.2511 after having made a high of $1.2526. The
In the ensuing week the euro could rally further to test 1.27 level. It is the euro's reaction to the 1.27 area of prices that will reveal clues to where the euro wants to go. While not bearish on the euro I would not buy the dips. Currency best avoided until a clear decisive break atop 1.27 or a decisive breakdown from there.
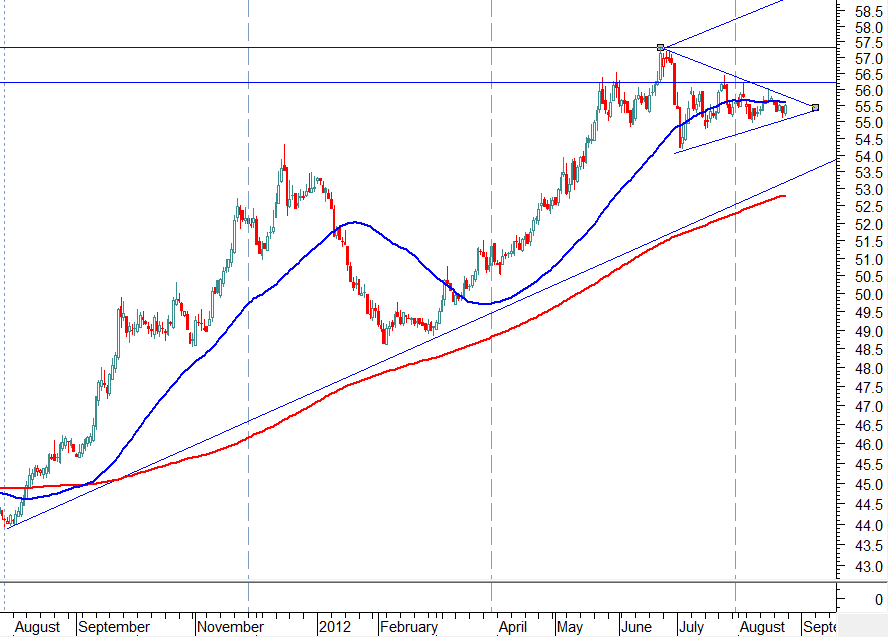 $-INR: The US dollar closed the week at 55.49.
The $ has been in a correction ever since hitting the top of 57.30 but this correction has played out in the triangle shown in the chart. Three things may be noted in the chart. Firstly, there is nothing bearish in the charts. The $ is well above the 200 DMA, its rally base trend-line and more or less on its 50 DMA. So the long-term trend up remains intact despite the correction. Secondly, the pennant shaped triangle is usually a trend continuation signal that confirms there is no reversal in basic trend. Lastly, within the triangle we have an A-B-C-D-E wave pattern, and we may be nearing E as the triangle terminates. In short we are due for a break out from the triangle very soon; possibly in the ensuing week or the next.
Which way will the $ break out? The odds are highly in favour of the main trend which is up. Wait for confirmation before buying the dollar. On a break-out the first target would be 56 and on confirmation of an upside from there, the previous top of 57.3 beckons. A break below 55 invalidates the above scenario.
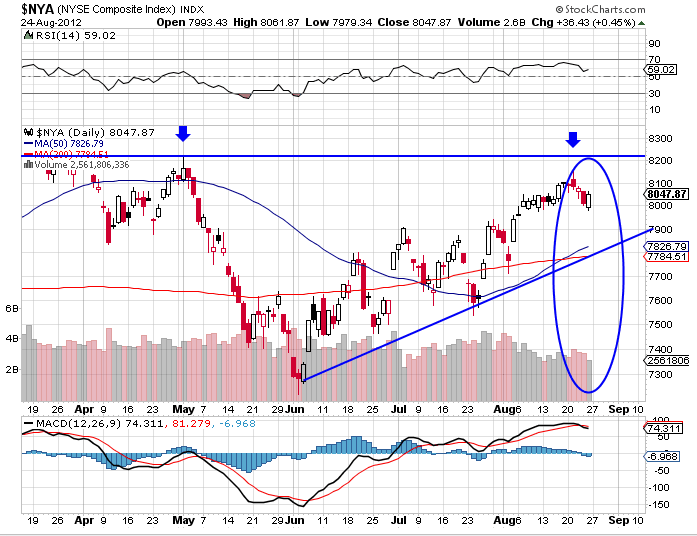 NYSE Composite: The NYSE Composite closed the week at 8048, well below the high of 8167. Is the rally over?
First note that the previous two highs of the NYSE Composite were 8336, preceded by 8691. The top made last week at 8167 was lower than both. So the index remains in long-term bear trend right from the top of 10,367 in August 2007. We are in a mega-bear market if you go by this composite index which includes all the stocks listed on the NYSE. That fact should be always kept in mind while looking at the narrower US indices like the DOW or even the S&P500.
Where do we go from here? Barring a highly unlike flareup again, the first target for the NYA is 7900 followed by a retest of its 200 DMA which is currently in the 7850 region.
Note, I expect the long-term trend-line stretching from the March 2009 low to the low of 7265 in May 2012 to be tested and possibly violated before a further rally in the index.
The corresponding downside target for S&P500 then is the 1360 area and it is the market's response to prices in this area that will set the further trend in US markets.
On the whole expect a very treacherous markets as the price levels could be driven purely by the technical play between bulls and bears as the new trend is established.
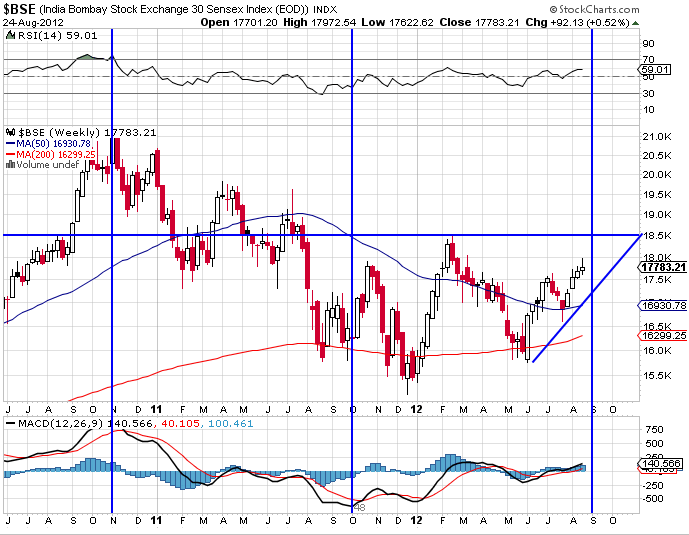 Sensex: The Sensex closed the week at 17,783 after having made a high of 17,972 the previous day. Is the rally over?
The fall on Friday was a clear violation of the rally's base trend-line stretching from the low of 16,598 on July 26. That doesn't terminate the rally but it does throw up a cautionary flag.
In the weekly chart above, the rally has room till 18,500 in terms of price and a week or two in terms of time to reach for a higher mark. Whether it will get there or not is difficult to say. But we are approaching a significant overhead resistance that can terminate the rally. Structurally, there is nothing bullish about the market in the medium- or long-term. It is best to get out while the going is good.
NB: These notes are just personal musings on the world market trends as a sort of reminder to me on what I thought of them at a particular point in time. They are not predictions and none should rely on them for any investment decisions
Sonali Ranade is a trader in the international markets